XB-IMG-124951
Xenbase Image ID: 124951
|
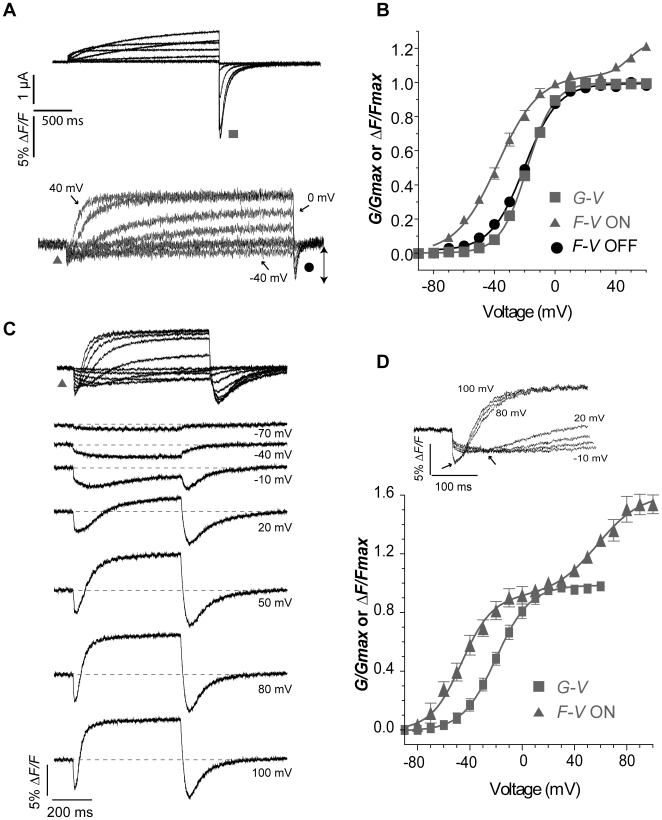
Figure 5. Relationship between E519C:C445V:C449V fluorescence signal and ionic conductance.(A) Representative current (above) and fluorescence traces (below) recorded using the same protocol as in Fig. 2A. (B) Comparison of G-V curve (squares, V½ = −18.3±1.2, k = 8.8±0.2 mV, n = 7) with fluorescence-voltage relationship from the tail of fluorescence (circles, F-VOFF; V½ = −20.6±1.2 mV, k = 11.4±0.6 mV, n = 16), measured at the times indicated by the symbols in panel A, and with fluorescence-voltage relationship from the peak fluorescence quenching upon depolarization (F-VON, triangles in panel A). The F-VON curve was obtained by plotting the maximum amplitude of the downward deflection for each trace, and normalized to +20 mV (estimated saturation voltage), and was best fit with a double Boltzmann function, as a second component appears at positive potentials (first phase: V½,1 = −37.8±1.7 mV, k1 = 13.7±0.7 mV; F-VON second phase: V½,2 = 43.5±7.9, k2 = 9.6±2.6 mV, n = 13; A1 = 0.96±0.2). (C) Representative fluorescence traces obtained during 500 ms depolarizing steps from −80 to potentials ranging from −90 to 100 mV. Membrane was then hyperpolarized at −110 mV for 500 ms. (D) Normalized G-V relationship (squares, V½ = −19.6±2.0, k = 13.8±2.7 mV, n = 3) obtained as in A compared to F-VON (first phase: V½,1 = −46.7±2.1 mV, k1 = 12.7±1.1 mV; F-VON second phase: V½,2 = 56.7±7.2, k2 = 16.9±3.9 mV, n = 3; A1 = 0.56±0.05). The inset shows the fluorescence signal from a representative cell, to highlight the first saturation step at about 0 mV and the second saturation step at about 80 mV. Image published in: Es-Salah-Lamoureux Z et al. (2010) Es-Salah-Lamoureux et al. Creative Commons Attribution license Larger Image Printer Friendly View |