XB-IMG-126299
Xenbase Image ID: 126299
|
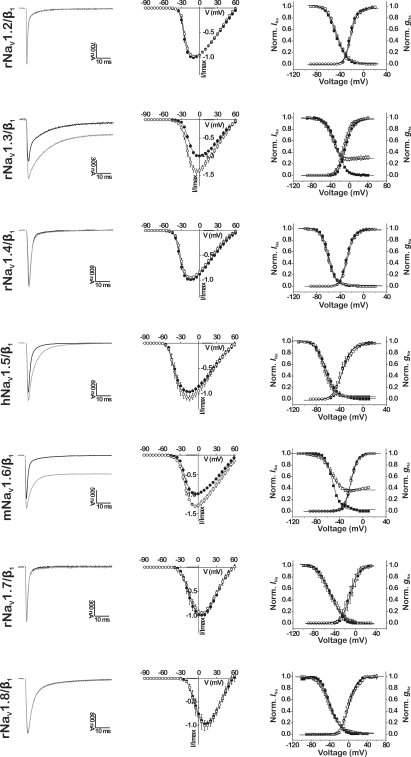
Figure 1. Effects of CgNa on cloned mammalian NaV channel subtypes NaV1. 2–NaV1.8/β1 expressed in Xenopus oocytes. The tested mammalian isoforms originate from rat (r), human (h), or mouse (m). Left-hand panels show representative whole-cell current traces in control (black traces) and in presence of 10 μM CgNa (gray traces). Middle panels show normalized current–voltage relationships (n = 3–7) in control (●) and in presence of 10 μM CgNa (○). Right-hand panels show steady-state activation and inactivation curves (n = 3–7) in control (● and ■, respectively) and in presence of 10 μM CgNa (○ and □, respectively), fit with the Boltzmann equation. Image published in: Billen B et al. (2010) Image downloaded from an Open Access article in PubMed Central. Copyright © 2010 Billen, Debaveye, Béress, Garateix and Tytgat. Larger Image Printer Friendly View |