XB-IMG-118409
Xenbase Image ID: 118409
|
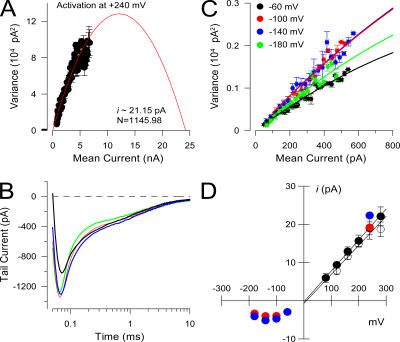
Figure 8. Nonohmic behavior of tail current amplitude at negative potentials is associated with nonohmic reductions in apparent average single channel current amplitude. In A, binned σ2/I relationships for four sets of 100 steps to +240 mV are displayed along with the best fit of Eq. 1 with i = 21.15 pA; N = 1146. In B, the tail currents (10 kHz filtering) after repolarization to −60 (black), −100 (red), −140 (blue), and −180 (green) mV from the initial step to +240 mV are shown on a logarithmic time base to emphasize the two exponential nature of the tail current decay. The peak of the tail current is essentially unchanged between −100 and −180 mV. In C, the binned σ2/I relationships for each of the tail currents shown in B are shown. N was constrained to the value obtained in B (N = 1146) and i obtained from the fit of Eq. 1. Apparent single channel current amplitude does not increase at potentials more negative than −100 mV, despite the increase in driving force. In D, the estimated i from examples like that in C are plotted as a function of voltage (red symbols), along with the estimates of i obtained from σ2/I analysis at positive potentials. Blue symbols correspond to records filtered at 50 kHz and red symbols to those filtered at 10 kHz. Image published in: Zhang X et al. (2006) Copyright © 2006, The Rockefeller University Press. Creative Commons Attribution-NonCommercial-ShareAlike license Larger Image Printer Friendly View |