XB-IMG-122774
Xenbase Image ID: 122774
|
|
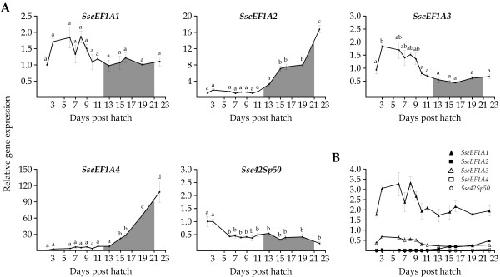
Figure 5. A) Relative SseEF1A expression levels during larval development (from 2 to 22 DPH) in Senegalese sole. Expression values were normalized to those of GAPDH2. Data are expressed as the mean fold change (mean ± SEM, n = 3) from the calibrator group (2 DPH). Different letters denote days that are significantly different (P < 0.05) analyzed by ANOVA followed by a Tukey test. The interval for the metamorphic process is shaded. B) Comparison of the relative levels of SseEF1A transcripts during larval development. Data are expressed as the ratio (calculated using 2-(ΔCt)) of target mRNA to GAPDH2 mRNA. Image published in: Infante C et al. (2008) Copyright © 2008 Infante et al; licensee BioMed Central Ltd. Creative Commons Attribution license Larger Image Printer Friendly View |