XB-IMG-129451
Xenbase Image ID: 129451
|
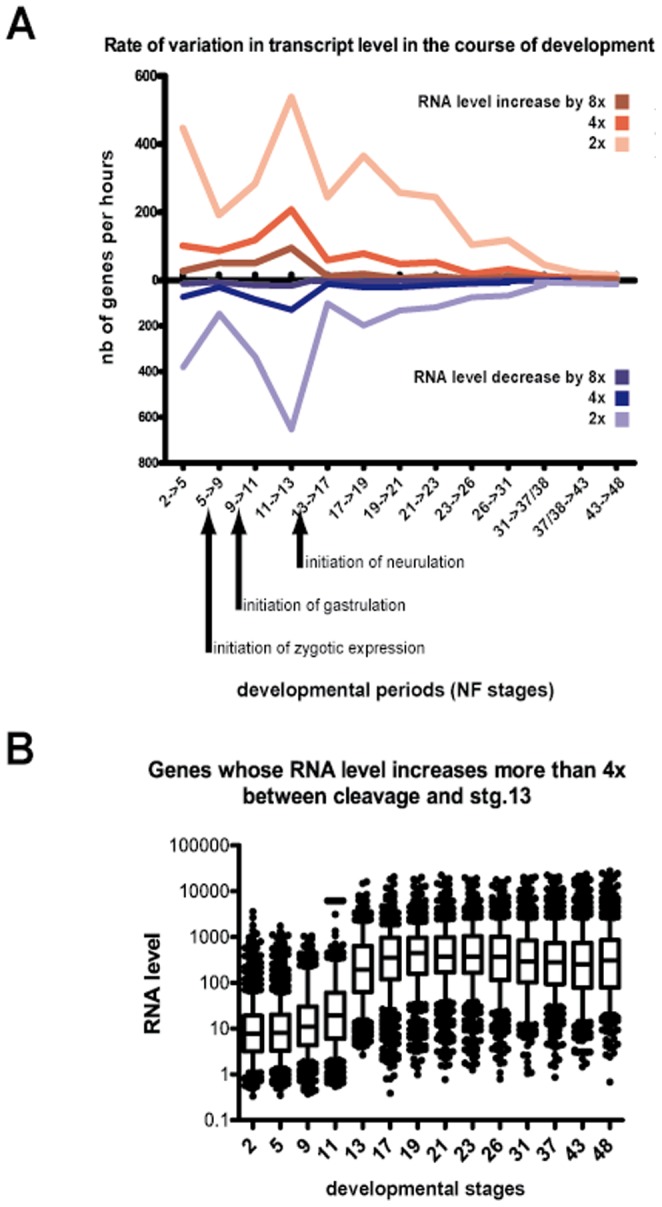
Figure 3. Rate of transcript level variation is maximal at gastrula stage.(A) Data from [23] were used to quantify transcription variations during normal development. The number of genes showing an RNA level increase or decrease by 2×, 4×, or 8× between two consecutive stages was plotted. Data were normalized by the duration, in hours, of each developmental period analysed. (B) The group of genes with RNA levels that increased 4× or more between stage 11 and stage 13 was considered, and the RNA levels of these genes were plotted at different developmental stages. The rectangles delineate the 25th and 75th percentiles, the horizontal bar is the median, and the whiskers indicate the 10th and 90th percentiles. Image published in: Rotman N et al. (2013) Image reproduced on Xenbase with permission of the publisher and the copyright holder. Creative Commons Attribution license Larger Image Printer Friendly View |