XB-IMG-121298
Xenbase Image ID: 121298
|
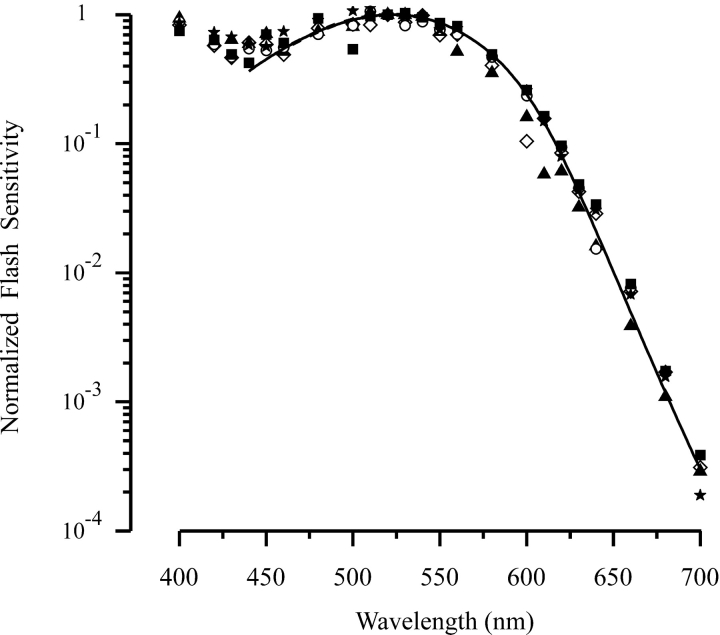
Figure 1. . Action spectra of Xenopus rods at different developmental stages. The normalized dim-flash sensitivity was calculated from r/IF (see text), and the sensitivity at 520 nm was then arbitrarily renormalized to unity. Data from one rod at each stage. Symbols: ○, stage 48; ▴, stage 50; ⋄, stage 55; ▪, stage 62; ★, frog at size of 2.5–5cm. Curve is drawn from Eq. 4. Image published in: Xiong WH and Yau KW (2002) Copyright © 2002, The Rockefeller University Press. Creative Commons Attribution-NonCommercial-ShareAlike license Larger Image Printer Friendly View |