XB-IMG-127302
Xenbase Image ID: 127302

|
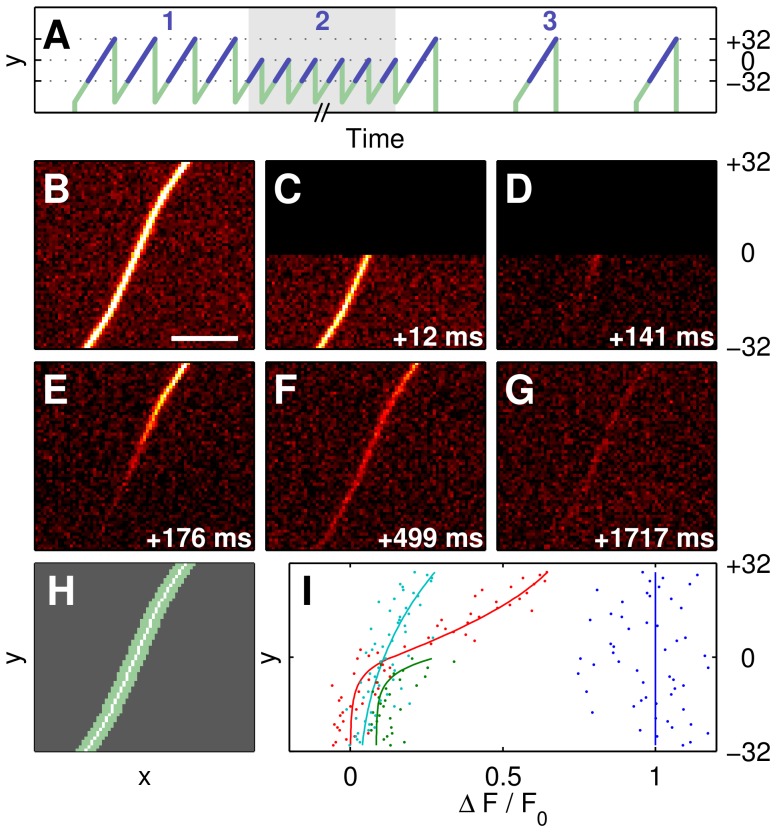
Figure 2. FRAP scanning protocol and sample data.(A) Schematic of the three-phase scanning protocol showing the position of the illumination line in pixel coordinates. In the first phase, several full frames are acquired to determine initial fluorescence. Half-frames are acquired in the second phase at high frame rate (488 f/s) for photobleaching in the lower half of the cilium. The third phase records the fluorescence redistribution due to diffusion at a low frame rate (28 f/s). Image acquisition (blue) is delayed in respect to the mirror position signal (green) for mirror response linearity. Time axis is not to scale, number of images reduced for simplicity. (B–H) Sample frames from all FRAP phases show evolution of fluorescence distribution, scale bar 5 , frame times relative to first frame. (B) Initial fluorescence. (C,D) First and last half-frame of the bleaching phase, upper half not imaged and displayed as black. (E) First full frame of the recovery phase shows inhomogeneous fluorescence distribution. (F) Mostly homogeneous distribution after 9 frames in the recovery phase. (G) Last frame of the recovery phase. (H) 2D pixel mask used for maximum projection of 2D intensities onto 1D position on cilium. (I) Projected intensity plots (dots) for selected frames (blue: data from frame B, green: bleaching phase (t = 51 ms), red: E, cyan: F), and corresponding best-fits (solid lines, for full data see Fig. 3B). Image published in: Alevra M et al. (2012) Alevra et al. Creative Commons Attribution license Larger Image Printer Friendly View |
