XB-IMG-121310
Xenbase Image ID: 121310
|
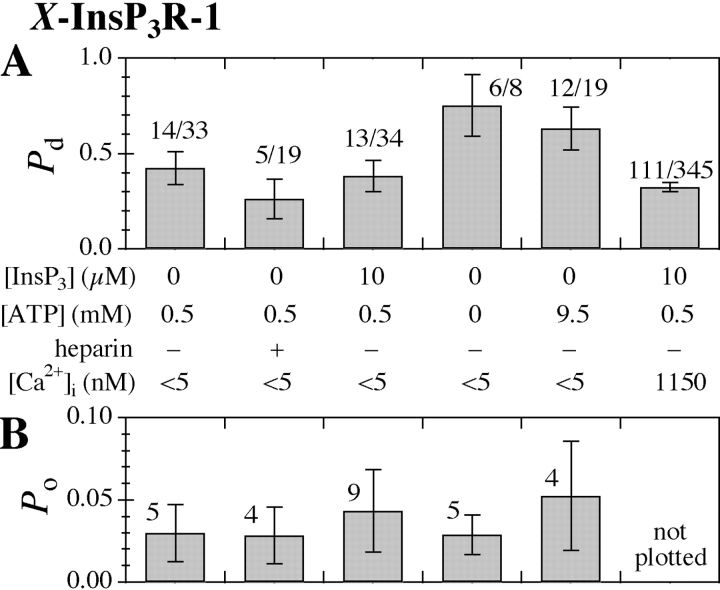
Figure 3. . (A) Pd and (B) Po histograms of the X-InsP3R-1 channel in various experimental conditions. In the Pd graph, numbers above each bar represent the fraction of nuclear membrane patches obtained that exhibited X-InsP3R-1 channel activities. In the Po graph, the number above each bar is the number of single-channel current records used to evaluate Po. Given the variance of the channel Po in experiments performed under the same experimental conditions, the channel Po observed under the various set of experimental conditions are not statistically different (P > 0.05 from t test) from Po observed under control conditions (0 InsP3, 0.5 mM ATP, [Ca2+]i < 5 nM). Image published in: Mak DO et al. (2003) Copyright © 2003, The Rockefeller University Press. Creative Commons Attribution-NonCommercial-ShareAlike license Larger Image Printer Friendly View |