XB-IMG-120109
Xenbase Image ID: 120109
|
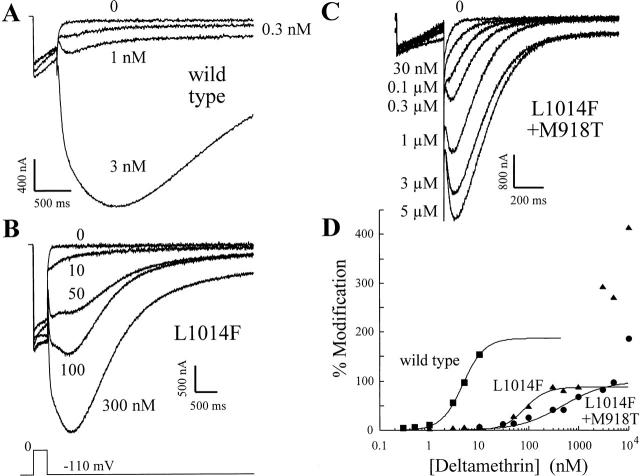
Figure 7. The kdr and super-kdr mutations reduce the potency of deltamethrin for sodium channels modified with ATX-II. All panels show Na currents measured in ≥500 nM ATX-II during a 320-ms depolarization to 0 mV and after repolarization to −110 mV. A–C show results for wild-type, kdr, and super-kdr mutants, respectively. The pulse protocol is shown below B. Note that C is shown on an expanded time scale. (D) Percent modification plotted versus deltamethrin concentration for wild-type, kdr, and super-kdr constructs (▪, ▴, and •, respectively). The fraction of modified channels was calculated using ; the ATX-II factor was made equal to one since all experiments were conducted in maximally effective ATX-II. The solid curves through the data indicate the best fits to the equation: percent modification = Mmax/{1 + (Kd/[δM])n}, where [δM] is the concentration of deltamethrin. Wild type (▪): Mmax = 187%, Kd = 4.71 nM, n = 2 · L1014F mutant; (▴): Mmax = 87.6%, Kd = 82 nM, n = 2. Data for concentrations of deltamethrin >1 μM were excluded from the curve fitting; L1014F + M918T double mutant (•): Mmax = 99.8%, Kd = 478 nM, n = 1. The datum point for 10 μM deltamethrin was excluded from the curve fitting. Each set of data was obtained with a single preparation. Image published in: Vais H et al. (2000) © 2000 The Rockefeller University Press. Creative Commons Attribution-NonCommercial-ShareAlike license Larger Image Printer Friendly View |