XB-IMG-123035
Xenbase Image ID: 123035
|
|
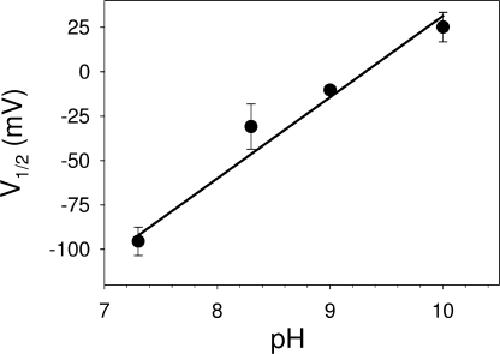
Figure 2. Dependence of the voltage of half-maximal activation on internal pH. Mean values of V1/2 are plotted as a function of pH. Error bars indicate SD. The straight line has a slope of 46 ± 2 mV per pH unit, corresponding to 20 mV per e-fold change of the H+ concentration. Image published in: Zifarelli G et al. (2008) © 2008 Zifarelli et al. Creative Commons Attribution-NonCommercial-ShareAlike license Larger Image Printer Friendly View |