XB-IMG-129217
Xenbase Image ID: 129217
|
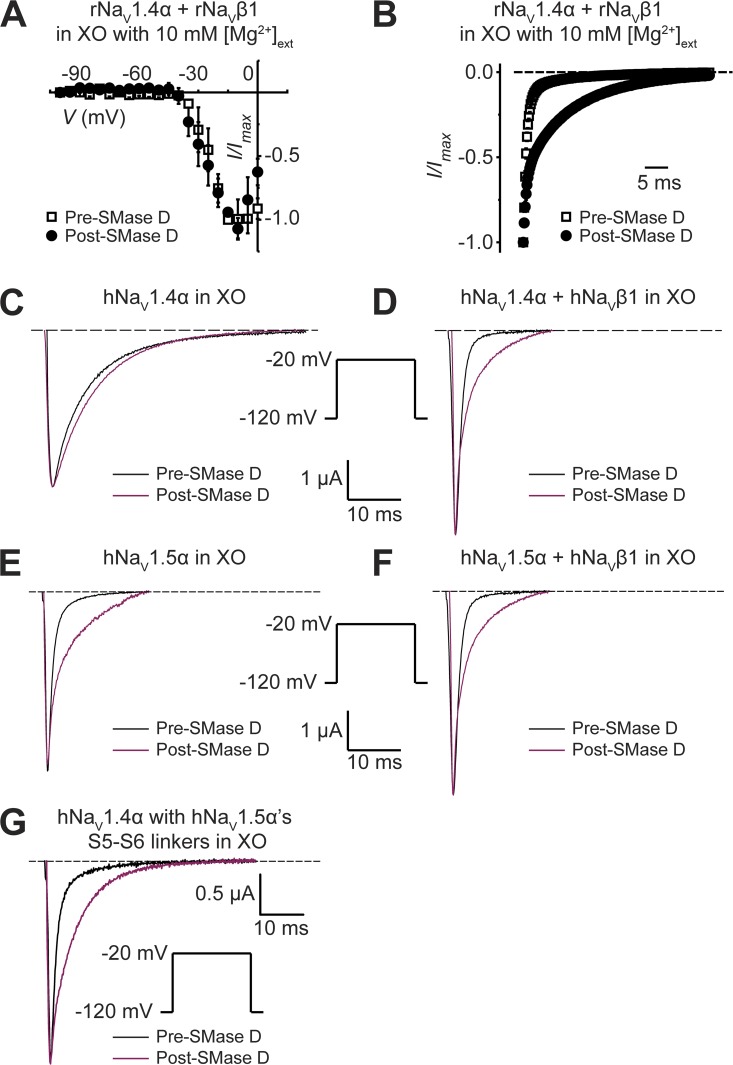
Figure 6. Effects of high Mg2+ and the NaVβ1 subunit on SMase D sensitivity of NaV channels. (A and B) rNaV1.4α + β1’s I-V curves (A) and inactivation time courses at −20 mV (B), collected in the presence of 10 mM of extracellular Mg2+ without (open squares) or with (closed circles) SMase D; all data are presented as means ± SEM (n = 3). (C–G) Currents of hNaV1.4α (C), hNaV1.4α + β1 (D), hNaV1.5α (E), hNaV1.5α + β1 (F), and mutant hNaV1.4α containing hNaV1.5α’s S5–S6 linkers (G), elicited by depolarizing the membrane from −120 to −20 mV before (black) and after (maroon) SMase D treatment. Dashed lines indicate the zero current level. Image published in: Combs DJ et al. (2013) © 2013 Combs et al. Creative Commons Attribution-NonCommercial-ShareAlike license Larger Image Printer Friendly View |