XB-IMG-124413
Xenbase Image ID: 124413
|
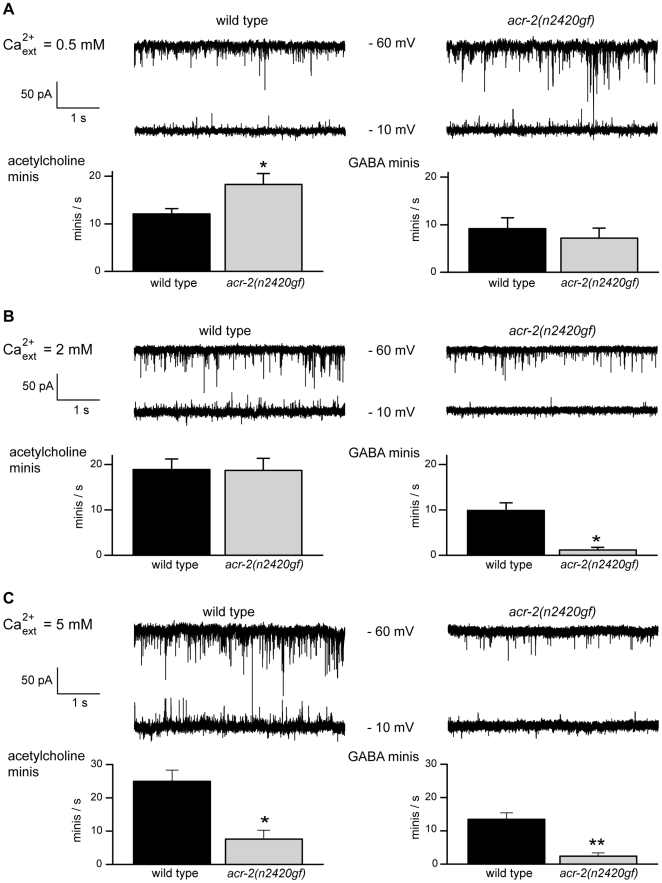
Figure 5. acr-2(n2420gf) mutants exhibit reduced GABA neurotransmission.(A) Representative traces (upper panel) and frequencies (lower panel) of endogenous postsynaptic currents recorded at two holding potentials, −60 and −10 mV, from wild-type and acr-2(n2420gf) worms in 0.5 mM external CaCl2. The frequency of miniature postsynaptic currents from cholinergic neurons is increased in the gain-of-function mutant (wild type: 12.1 events/s±1.1 SEM, n = 8; acr-2(n2420gf): 18.3 events/s±2.2 SEM, n = 9; *p = 0.0307). The frequency of miniature currents induced by GABAergic motor neurons was only slightly reduced in the gain-of-function mutant (wild type: 9.2 events/s±2.3 SEM, n = 8; acr-2(n2420gf): 7.2 events/s±2.1 SEM, n = 9; p = 0.5342). Data were analyzed using a two-tailed unpaired t-test. (B) Representative traces (upper panel) and frequencies (lower panel) of endogenous postsynaptic currents recorded at two holding potentials, −60 and −10 mV, from wild-type and acr-2(n2420gf) worms in 2 mM external CaCl2. Acetylcholine currents frequencies recorded from the wild type (18.9 events/s±2.3 SEM, n = 10) and acr-2(n2420gf) (18.7 events/s±2.6 SEM, n = 14) are not significantly different (p = 0.9555). GABA currents recorded from the wild type (9.9 events/s±1.7 SEM, n = 10) and acr-2(n2420gf) (1.2 events/s±0.6 SEM, n = 14) are significantly different (*p = 0.0007). Data were analyzed using a two-tailed unpaired t-test with Welch's correction. (C) Representative traces (upper panel) and frequencies (lower panel) of endogenous postsynaptic currents recorded at two holding potentials, −60 and −10 mV, from wild-type and acr-2(n2420gf) worms in 5 mM external CaCl2. Acetylcholine currents frequencies recorded from the wild type (24.9 events/s±3.4 SEM, n = 8) and acr-2(n2420gf) (7.6 events/s±2.7 SEM, n = 7) are significantly different (*p = 0.0017). GABA currents recorded from the wild type (13.4 events/s±2.0 SEM, n = 8) and acr-2(n2420gf) (2.3 events/s±1.0 SEM, n = 7) are significantly different (**p = 0.0004). Data were analyzed using a two-tailed unpaired t-test. Image published in: Jospin M et al. (2009) Jospin et al. Creative Commons Attribution license Larger Image Printer Friendly View |