XB-IMG-122540
Xenbase Image ID: 122540
|
|
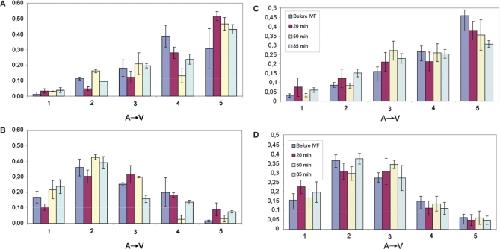
Figure 2. Intracellular gradients (A→V) of mRNA levels in Xenopus laevis oocytes. Distribution of (A) Vg1 and (B) Oct60 expression density along the oocyte animal–vegetal axis. The RNA was prepared from two to three individual eggs (standard error of the means indicated by error bars) from four different females (indicated by regular bars). Effect of fertilization. Distribution of (C) Vg1 and (D) Oct60 along the animal–vegetal axis. RNA was prepared from at least six eggs before IVF and at 20, 50 and 85 min after fertilization. Error bars indicate standard error of the means. Image published in: Sindelka R et al. (2008) © 2007 The Author(s). Creative Commons Attribution-NonCommercial license Larger Image Printer Friendly View |