XB-IMG-121312
Xenbase Image ID: 121312
|
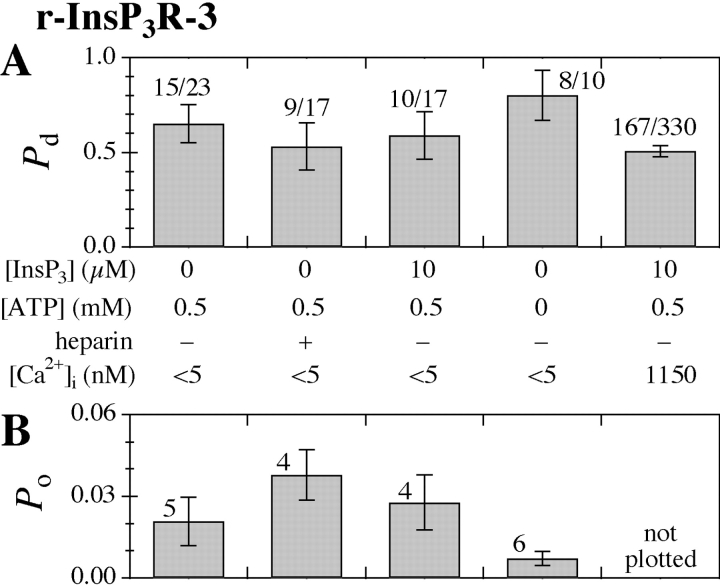
Figure 5. . (A) Pd and (B) Po histograms of the r-InsP3R-3 channel in various experimental conditions. Numbers tabulated in the graphs have the same meanings as in Fig. 3. Given the variance of the channel Po in experiments performed under the same experimental conditions, the channel Po observed under the various set of experimental conditions are not statistically different (P > 0.05 from t test) from Po observed under control conditions (0 InsP3, 0.5 mM ATP, [Ca2+]i < 5 nM). Image published in: Mak DO et al. (2003) Copyright © 2003, The Rockefeller University Press. Creative Commons Attribution-NonCommercial-ShareAlike license Larger Image Printer Friendly View |