XB-IMG-123293
Xenbase Image ID: 123293
|
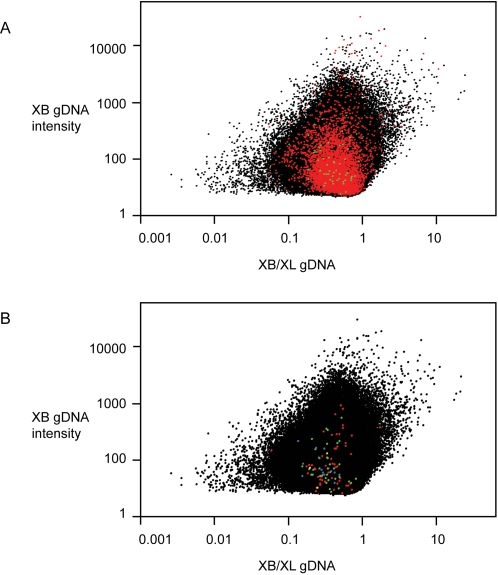
Figure 2. The gDNA ratio of probes that perfectly match (PM) XL and XB overlaps extensively with the gDNA ratio of probes that mismatch (MM) one species.(A) XB gDNA intensity versus gDNA ratio of PM probes in XL, XL and XB, and XB. PM probes in XL are in black, PM probes in XL and XB are in red, and PM probes in XB but not XL are in green. (B) XB gDNA intensity versus gDNA ratio of MM probes in XB. For comparative purposes, PM probes in XL are again in black. Probes that mismatch both paralogs of genes in XB with one, two, three, or four base pair differences are indicated in red, blue, green, and yellow respectively. Image published in: Chain FJ et al. (2008) Chain et al. Creative Commons Attribution license Larger Image Printer Friendly View |