XB-IMG-121169
Xenbase Image ID: 121169
|
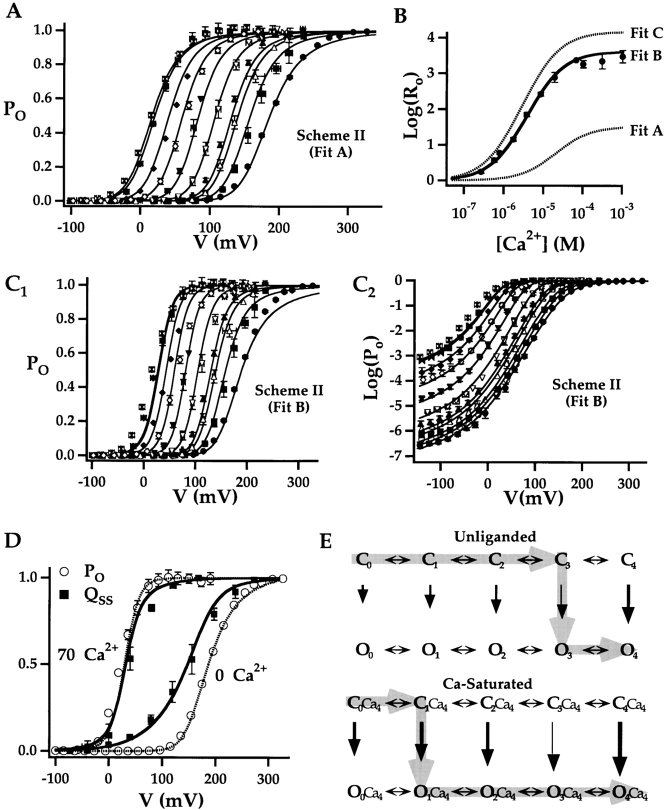
Figure 10. . Fitting steady-state data with Scheme II. (A) Mean PO-V relationships in different [Ca2+](in μM: 0 (•), 0.27 (▪), 0.58 (▵), 0.81 (▴), 1.8 (▿), 3.8 (▾), 8.2 (⋄), 19 (♦), 68 (), 99 ()) were fit by Scheme II by holding L0, zL constant and allowing the other parameters to vary (Fit A, Table II). (B) Mean log(RO)-[Ca2+] relationship (symbols) is compared with predictions of Scheme II based on different fits to the PO data (Table II, Fits A, B, and C). (C) Mean PO (C1) and log(PO) (C2) are plotted versus voltage for different [Ca2+] (symbols) and are fit by Scheme II (Table II, Fit B). The linear and log transformed data were fit simultaneously using a weighting function to compensate for the greater amplitude range of log(PO). (D) Scheme II reproduces (lines) the observed change in relationship between mean steady-state Q-V and PO-V relationships (Table II, Fit B parameters). (E) Gating schemes for unliganded and Ca2+-saturated channels illustrate the changes in equilibria induced by Ca2+ binding. By increasing the C-O equilibrium constants Ca2+ has the effect of changing the primary activation pathway, accounting in part for the altered relationship between Q-V and G-V. Image published in: Horrigan FT and Aldrich RW (2002) Copyright © 2002, The Rockefeller University Press. Creative Commons Attribution-NonCommercial-ShareAlike license Larger Image Printer Friendly View |