XB-IMG-127011
Xenbase Image ID: 127011
|
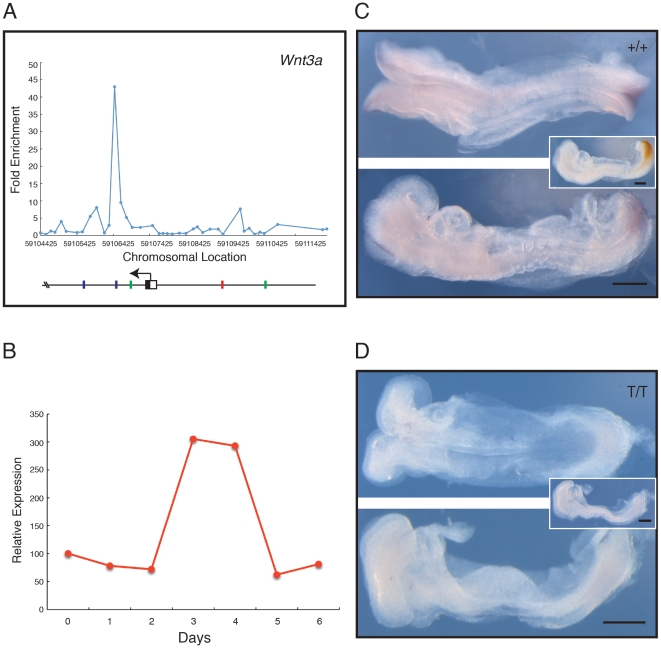
Figure 4. Analysis of Wnt3a, a positive regulator of the Wnt pathway.(A) Location analysis of Wnt3a. The figure (and Figs. 5, 6) shows fold enrichment against chromosomal position. Plot is the mean of triplicate chip results, aligned to the mm8 Feb. 2006 assembly. Blue bars represent the T box-like site TSACANNT (N = any base, S = G/C); green bars represent (AC)n; red bars the consensus TCACACCT. Stars above bars represent sequence on reverse strand. (B) Quantitative RT-PCR expression profile for Wnt3a during ES cell differentiation, expressed relative to beta actin. (C, D) Expression of Wnt3a studied by in situ hybridisation; in each, the top image shows a dorsal view, and the bottom image a lateral view. (C) Phenotypically wild type (+/+ or +/T) embryo at E8.5–8.75, and (D) a mutant (T/T) embryo from crosses of Brachyury heterozygous mutant mice. Wnt3a expression is detected with NBT/BCIP (purple) and the insets show a lateral view after double staining for Brachyury detected with INT/BCIP (orange brown). Note that in the wild type embryo Wnt3a is expressed in tailbud and paraxial mesoderm. In the mutant embryo expression of Wnt3a staining is absent or greatly reduced (n = 3). Scale bars indicate 250 µm. Image published in: Evans AL et al. (2012) Evans et al. Creative Commons Attribution license Larger Image Printer Friendly View |