XB-IMG-127304
Xenbase Image ID: 127304
|
|
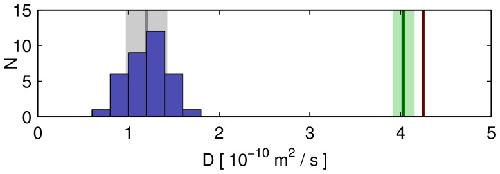
Figure 4. Distribution of diffusion coefficients.Blue: histogram of best-fit results for diffusion coefficients of fluorescein from 35 cilia, with mean and standard deviation as dark gray line and light gray area, respectively. The diffusion coefficient of fluorescein in aqueous solution at 25°C [14] is shown in red, while values corrected for a range of (23±1)°C are shown in green. Image published in: Alevra M et al. (2012) Alevra et al. Creative Commons Attribution license Larger Image Printer Friendly View |