XB-IMG-125878
Xenbase Image ID: 125878
|
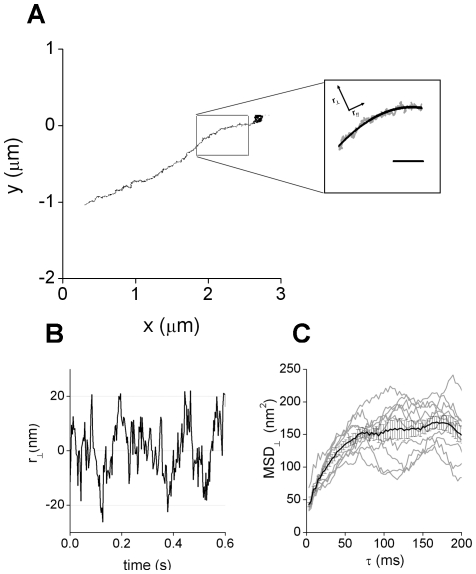
Figure 1. Analysis of melanosomes motion perpendicular to the transport axis.(A) Representative trajectory of a melanosome moving along a microtubule. The continuous line shows the average position calculated for the microtubule. Scale bar, 200 nm (B) Motion on the perpendicular direction obtained after analyzing the trajectory represented before (C) Mean square displacement obtained from characteristic trajectory segments for the motion perpendicular to the transport direction (gray lines). The black lines show the average and standard error calculated for each data point. Image published in: Bruno L et al. (2011) Bruno et al. Creative Commons Attribution license Larger Image Printer Friendly View |