XB-IMG-194814
Xenbase Image ID: 194814
|
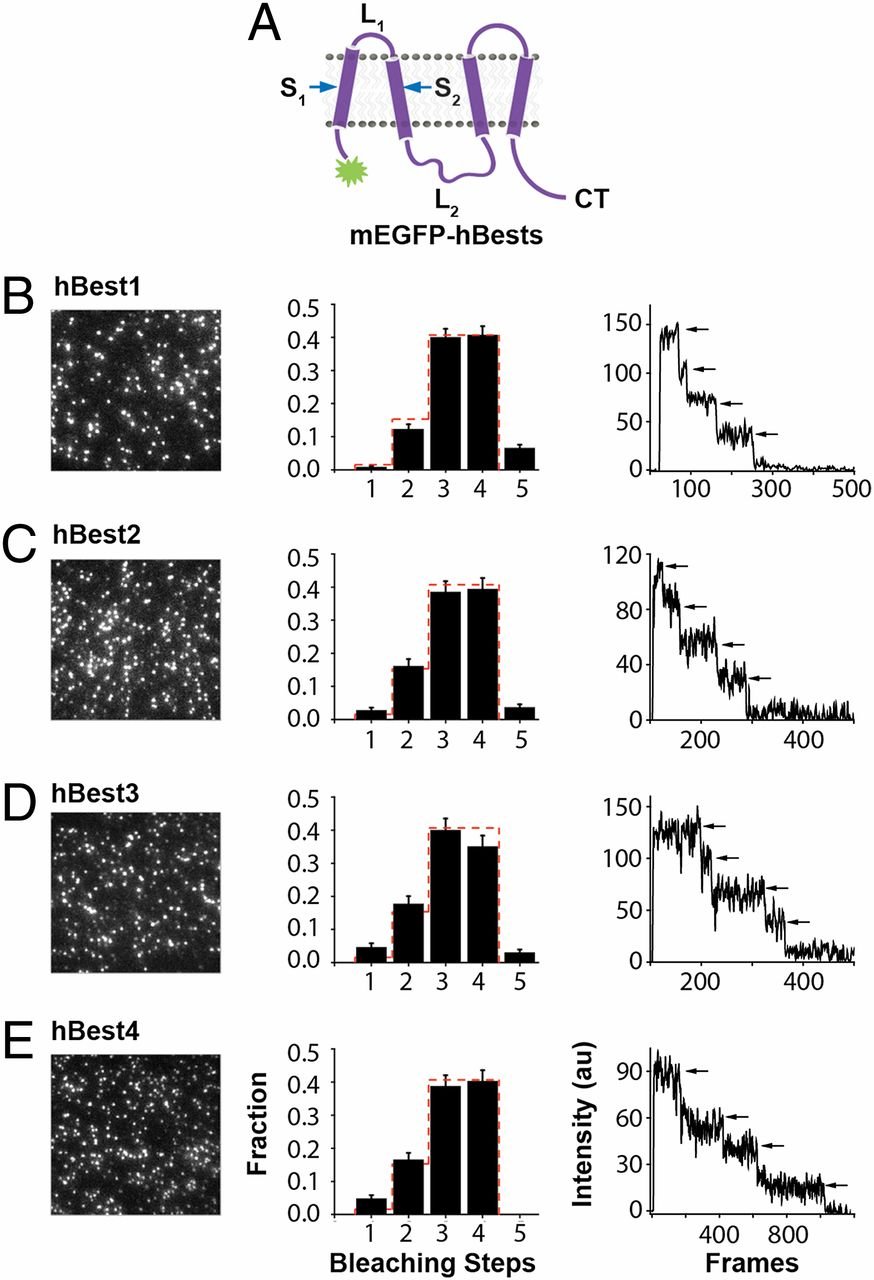
Fig. 1.
Single-molecule subunit counting on the four members of the bestrophin family. (A) hBest cartoon here and elsewhere based on Milenkovic topology model. (B–E) Single-molecule irreversible photobleaching to count number of mEGFPs per fluorescent spot (i.e., number of subunits per channel) in hBest1 (B), hBest2 (C), hBest3 (D), and hBest4 (E). (Left) Images show first frame of the movie to indicate density of spots. (Middle) Average frequency distributions of number of bleaching steps (black bars) with error bars indicating SEM. Dashed red line indicates theoretical binominal distribution for tetramer with probability that mEGFP is fluorescent = 0.80. (Right) Fluorescence traces from single spots showing four steps of photobleaching. Image published in: Bharill S et al. (2014) Copyright © 2014. Image reproduced with permission of the Publisher and the copyright holder. This is an Open Access article distributed under the terms of the Creative Commons Attribution License. Larger Image Printer Friendly View |