XB-IMG-124749
Xenbase Image ID: 124749
|
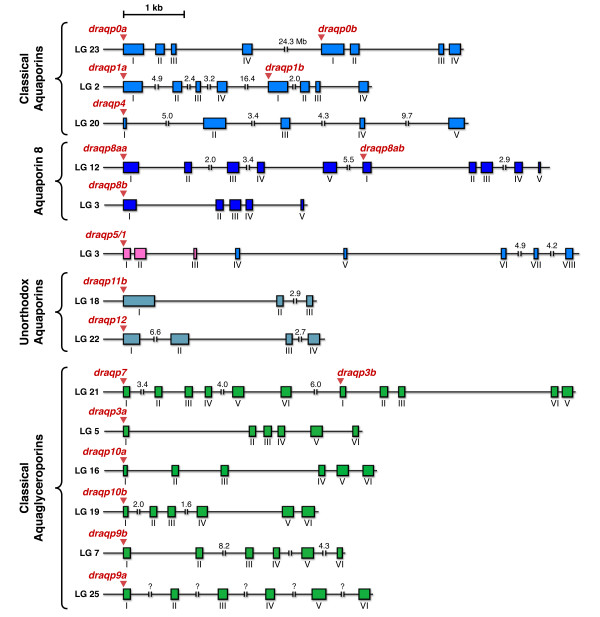
Figure 3. Genomic organization of zebrafish aquaporins. Schematic representation of zebrafish aquaporin gene structures and chromosomal loci. The boxes indicate exons with coding regions only. Distances are in kb or in Mb when indicated. In the case of draqp9a, the quality of the genomic sequence available was insufficient to establish the size of the introns. Image published in: Tingaud-Sequeira A et al. (2010) Copyright ©2010 Tingaud-Sequeira et al; licensee BioMed Central Ltd. Creative Commons Attribution license Larger Image Printer Friendly View |