XB-IMG-121100
Xenbase Image ID: 121100
|
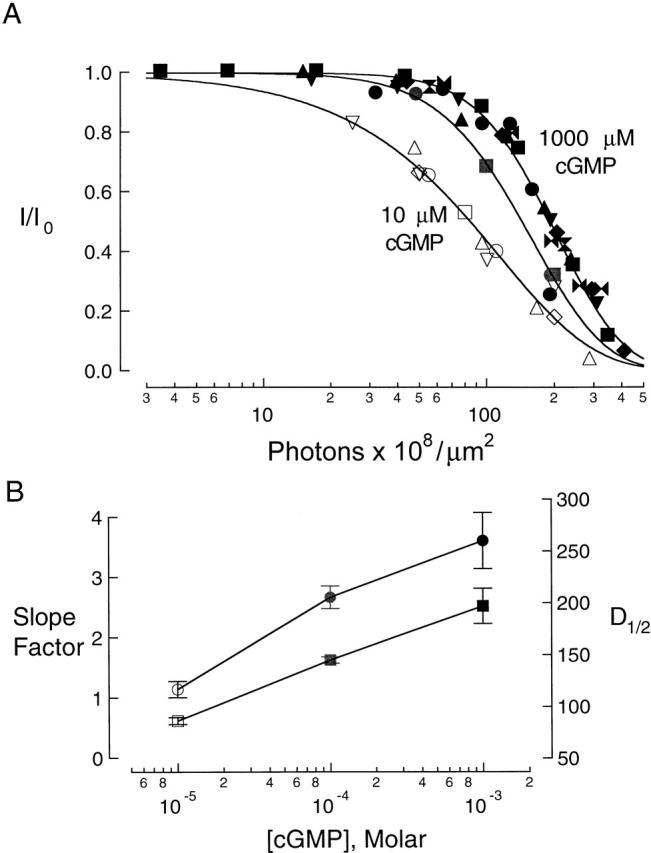
Figure 3. UV effect on OLF channels activated by different, initially saturating cGMP concentrations. (A) UV dose–response relations for OLF channels activated by 10 μM cGMP (open symbols, five experiments), 100 μM cGMP (gray symbols, two experiments), and 1,000 μM cGMP (black symbols, seven experiments). D1/2, the UV dose that reduced the current amplitude to one half its initial value, was estimated for each experiment by fitting the UV dose–response relation with the all-or-none model (). The points from each experiment were then shifted along the abscissa so that the D1/2 value of the shifted results was equal to the average D1/2 value of the unshifted results for all experiments at the same cGMP concentration. Different symbols represent separate experiments. Continuous curves are fits to the pooled results for each concentration using . Patches were irradiated with 280 nm UV in the absence of cGMP. (B) Half-maximal UV dose in photons × 108 · μm−2, (squares), and slope factor (circles) from the fits in A, plotted as a function of cGMP concentration. The UV parameters are listed in Table . Image published in: Middendorf TR and Aldrich RW (2000) © 2000 The Rockefeller University Press. Creative Commons Attribution-NonCommercial-ShareAlike license Larger Image Printer Friendly View |