XB-IMG-174512
Xenbase Image ID: 174512
|
|
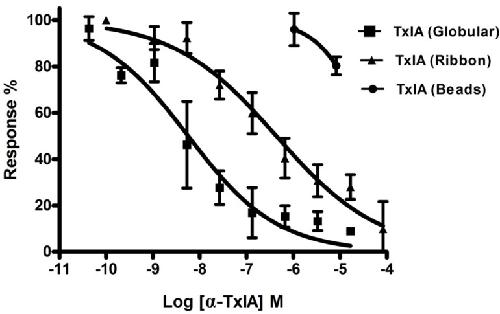
Figure 8. Inhibition concentration-response curves for the isomers of α-CTx TxIA. Values are mean ± SEM from 6 to 10 separate oocytes. Globular, Ribbon and Beads isomers were tested on rat α3β2 nAChRs expressed in Xenopus oocytes. Image published in: Wu Y et al. (2014) © 2014 by the authors. Creative Commons Attribution license Larger Image Printer Friendly View |