XB-IMG-125131
Xenbase Image ID: 125131

|
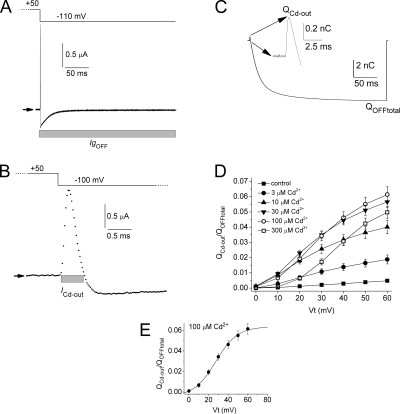
Figure 5. Effect of [Cd2+]e on the magnitude of ICd-out. (A) IgOFF in the presence of 30 µM Cd2+. Arrows indicate zero current level. Gray bar indicates region of IgOFF integrated to obtain total QOFF. (B) ICd-out shown in A, plotted on an expanded time scale. Gray bar indicates the region of IgOFF integrated to obtain QCd-out. (C) Integral of IgOFF. Inset shows QOFF at greater resolution. (D) Plot of QCd-out/QOFF total as a function of Vt and [Cd2+]e. Also shown is a plot of QCd-out versus Vt for control conditions. (E) Plot of QCd-out/QOFF total as a function of Vt for 100 µM Cd2+ and fitted to a Boltzmann function (smooth curve): V1/2 = 27 mV; slope factor = 11.0 mV; maximum value of QCd-out/QOFF total = 0.064. Image published in: Abbruzzese J et al. (2010) © 2010 Abbruzzese et al. Creative Commons Attribution-NonCommercial-ShareAlike license Larger Image Printer Friendly View |
