XB-IMG-125004
Xenbase Image ID: 125004
|
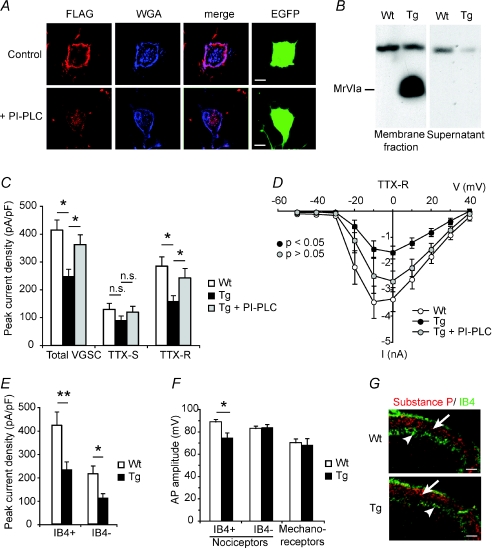
Figure 3. t-MrVIa acts at the cell membrane and specifically blocks TTX-R currents with no compensatory upregulation of other VGSCsA, t-MrVIa (FLAG: red) colocalizes with the membrane marker WGA (blue) in DRG neurones co-electroporated with t-MrVIa and cytoplasmic EGFP (upper panel). PI-PLC treatment eliminates FLAG immunoreactivity showing specific cleavage of the GPI-anchored toxin from the membrane (lower panel). Scale bars: 5 μm. B, mammalian cells transfected with t-MrVIa show expression of the toxin in the membrane fraction by FLAG immunoprecipitation. C, bar graph indicating the quantification of VGSC peak currents in nociceptors of wild-type (Wt) and Tg-t-MrVIa mice (n= 32 cells per group) before and after TTX and PI-PLC treatment (n= 12 cells). The current densities of total VGSC and TTX-R currents are significantly reduced in Tg-t-MrVIa mice compared to wild-type mice, and significantly recover from t-toxin inhibition after PI-PLC treatment. TTX-S currents are not significantly affected in Tg-t-MrVIa mice. D, current–voltage relationships of TTX-R currents indicate a significant inhibition of sodium currents in nociceptors of Tg-t-MrVIa mice in comparison to Wt littermates (P < 0.05 two-way-ANOVA), and no significant inhibition, with respect to Wt, in Tg-t-MrVIa mice after PI-PLC treatment (P > 0.05 two-way ANOVA). E, peak current measurements in nociceptors treated with TTX and live-labelled with isolectin B4 indicate that IB4+ve nociceptors display more TTX-R than IB4–ve nociceptors in Wt and Tg mice and that t-MrVIa inhibition is significant in both subpopulations but more pronounced in IB4+ve nociceptors (n= 10–22 cells per group). F, the mean amplitude of action potentials is significantly reduced in IB4+ve nociceptors (Wt: 89.2 ± 2.3 mV, Tg-t-MrVIa: 74.3 ± 3.9 mV) but not in IB4–ve nociceptors and mechanoreceptors (t test). (n= 9–20 per group.) G, immunodetection of substance P (red) and isolectin B4 (green) in dorsal spinal cord indicate no differences in afferent innervation between Wt and Tg-t-MrVIa adult mice. Scale bar: 50 μm, t test in C and E. Image published in: Stürzebecher AS et al. (2010) Image downloaded from an Open Access article in PubMed Central. Journal compilation © 2010 The Physiological Society Larger Image Printer Friendly View |