XB-IMG-125252
Xenbase Image ID: 125252

|
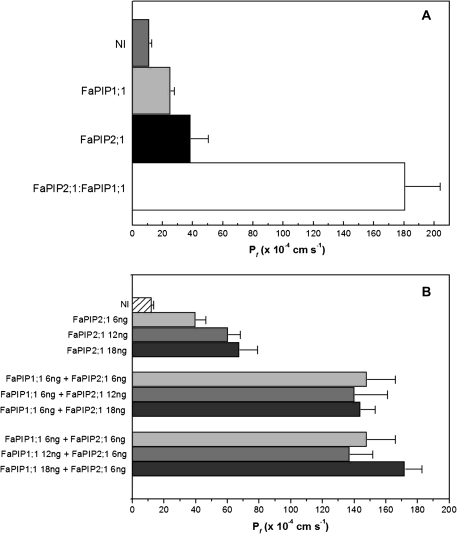
Fig. 4. Co-expression of FaPIP2;1 and FaPIP1;1. (A) Co-expression of 3 ng of cRNA of FaPIP2;1 with 12 ng of cRNA of FaPIP1;1 is shown (white bar). As a control, 3 ng of FaPIP2;1 (black bar) and 12 ng of FaPIP1;1 (light grey bar) were injected separately. The co-expression increased significantly the water permeability six times compared with the expression of FaPIP2;1 alone (p <0.05). Data are expressed as mean Pf±SEM, n=5 or 6 oocytes. NI are non-injected oocytes (grey bar). (B) Increasing cRNA mass of FaPIP2;1 injected alone in oocytes (from 6 ng to 18 ng) shows a increasing Pf. This relationship is not observed in FaPIP2;1-FaPIP1;1 co-expressing oocytes. Pf remains high but constant no matter the cRNA mass ratio injected. Data are shown as mean Pf ±SEM, n=6–8 oocytes. Image published in: Alleva K et al. (2010) © 2010 The Author(s). Creative Commons Attribution-NonCommercial license Larger Image Printer Friendly View |
