XB-IMG-124689
Xenbase Image ID: 124689

|
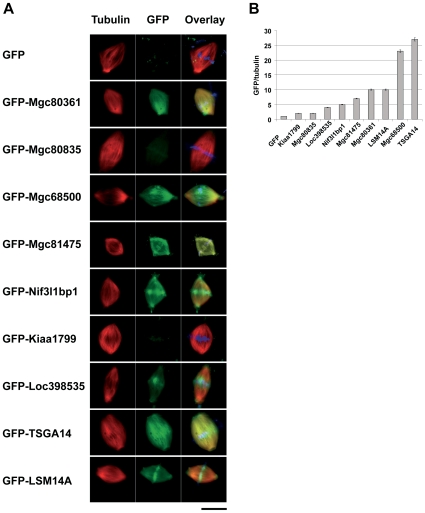
Figure 3. Localization of GFP-tagged candidate proteins at egg extract spindles.A. Spindles assembled in egg extracts in the presence of GFP-tagged candidate proteins. Size bar – 20 µm. Overlay column shows red (tubulin), green (GFP) and blue (DNA) signals. B. Relative intensities of the GFP fluorescence of the spindles assembled in the presence of nine GFP-tagged candidate proteins, normalized to the Rhodamine-tubulin signal. Values represent average from at least 10 spindles per sample. The ratio of GFP signal to tubulin fluorescence intensity for GFP alone was considered as 1. Error bars show s.e.m. Image published in: Gache V et al. (2010) Gache et al. Creative Commons Attribution license Larger Image Printer Friendly View |
