XB-IMG-125498
Xenbase Image ID: 125498

|
|
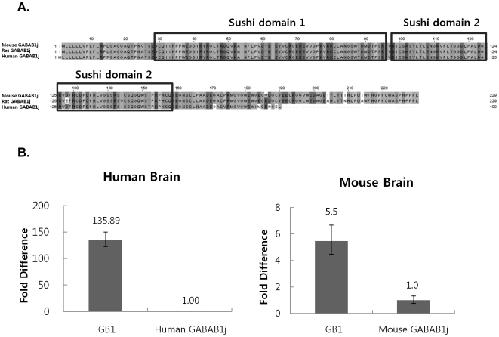
Figure 2. Sequences for human, mouse, and rat GABAB1j isoforms and relative expression levels.A. Sequence alignment of human, mouse, and rat GABAB1j showed a different C-terminal pattern in human GABAB1j. B. Human and mouse GABAB1j mRNA expression levels were measured with quantitative real-time PCR. GB1 primer and probe sets were used to detect most known major GABAB1 isoforms except GABAB1j. Human and mouse GABAB1j primer and probe sets were specific for only GABAB1j. GB1 expressions were shown as fold differences from human and mouse GABAB1j. Although a previous rat GABAB1j study indicated that GB1 and GABAB1j expression levels were similar, human and mouse GABAB1j expressions were lower than GB1. Mouse GABAB1j expression was 5.5 fold lower than GB1 expression, and human GABAB1j showed 135.89 fold lower expression. If the fold differences were compared, human GABAB1j expression level was much less (25 times) than mouse GABAB1j expression. Therefore, GABAB1j expressions vary across species. Image published in: Mayfield RD and Harris RA (2010) Lee et al. Creative Commons Attribution license Larger Image Printer Friendly View |
