XB-IMG-125617
Xenbase Image ID: 125617
|
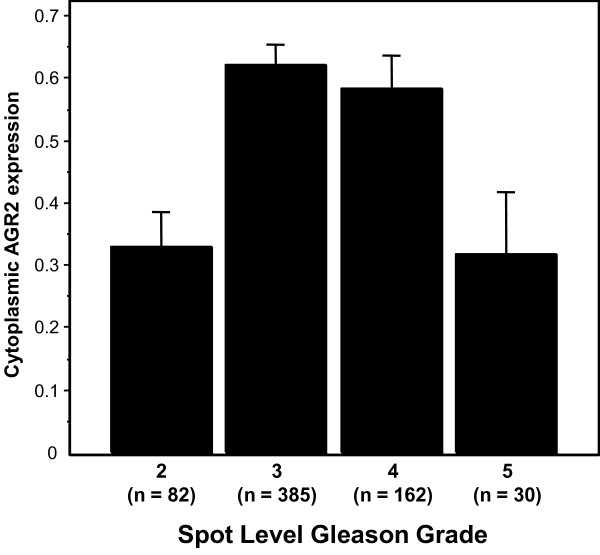
Figure 4. AGR2 expression by spot level Gleason grade. The barplots show the mean integrated AGR2 expression by TMA spot-level Gleason grade; bars are standard errors. Average AGR2 expression was increased in grades 3 and 4 compared to grade 2 (P < 0.0001 and P = 0.0007) and grade 5 (P = 0.0028 and P = 0.0085). Image published in: Maresh EL et al. (2010) Copyright ©2010 Maresh et al; licensee BioMed Central Ltd. Creative Commons Attribution license Larger Image Printer Friendly View |