XB-IMG-194826
Xenbase Image ID: 194826
|
|
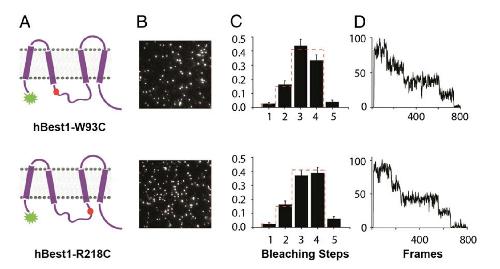
Fig. S7. Single-molecule subunit counting on (A) hBest1:W93C and (B) hBest:R218C. (A) Cartoons of the mutants based on Milenokovic topology model. Red
spots indicate location of mutations. EGFP was fused at N terminus of the mutants. (B) Images show first frame of the movie to indicate density of spots. (C)
Average frequency distributions of number of bleaching steps (black bars). Error bars indicate SEM. Dashed red line indicates theoretical binominal distribution
for tetramer with probability that EGFP is fluorescent = 0.80. (D) Example fluorescence traces from single spots showing four steps of photobleaching. Image published in: Bharill S et al. (2014) Copyright © 2014. Image reproduced with permission of the Publisher and the copyright holder. This is an Open Access article distributed under the terms of the Creative Commons Attribution License. Larger Image Printer Friendly View |