XB-IMG-117469
Xenbase Image ID: 117469
|
|
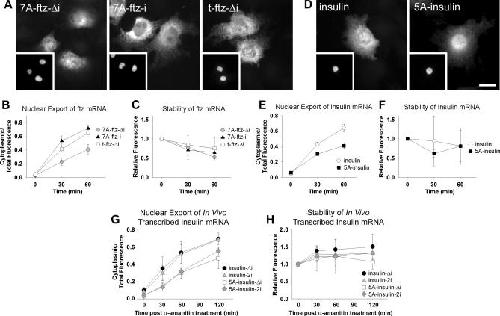
Figure 7. Silent Adenine Mutations Inhibit SSCR-Dependent Nuclear Export of mRNA(A–C) COS-7 cells were microinjected with t-ftz transcripts containing seven silent adenine mutations within the SSCR. FITC-conjugated 70-kDa dextran was co-injected as a marker (insets). Cells were incubated for 1 h (A) or various time points (B and C) to allow for export, then fixed and probed for ftz mRNA (A). Quantification of nuclear export (B) and stability (C) were performed as in Figure 2C and 2D.(D–F) As in (A–C), except that COS-7 cells were microinjected with either wild-type insulin transcripts or an insulin transcript containing five silent adenine mutations within the SSCR (5A-insulin). FITC-conjugated 70-kDa dextran was co-injected (insets). Cells were incubated for 1 h (D) or various time points (E and F) to allow for export, then fixed and probed for ftz mRNA (D). Quantification of nuclear export (E) and stability (F) as in Figure 2C and 2D. Scale bar = 15 μm.(G and H) COS-7 cells were microinjected with plasmids containing the indicated genes. After 30 min, the cells were treated with α-amanatin and incubated for the indicated time points. The cells were then fixed and probed for ftz mRNA. Quantification of nuclear export (G) and stability (H) were performed as in Figure 2C and 2D, except that each data point represents the average of four experiments, each of which consisted of 20–40 cells. Error bars represent the standard deviation between the four experiments. Image published in: Palazzo AF et al. (2007) Copyright: © 2007 Palazzo et al. Creative Commons Attribution license Larger Image Printer Friendly View |