XB-IMG-126190
Xenbase Image ID: 126190

|
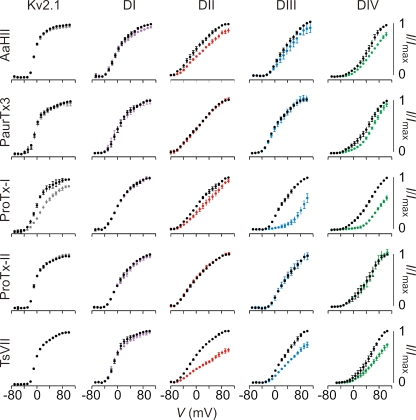
Figure 3. Sensitivity of hNav1.9/Kv2.1 constructs to extracellular toxins. Effects of toxins on Kv2.1 and chimeric constructs where paddle motifs were transferred from hNav1.9 into Kv2.1. Normalized tail current voltage–activation relationships are shown where tail current amplitude is plotted against test voltage before (black) and in the presence of toxin (other colors). Data are grouped per toxin (horizontally) and per chimera or wild-type Kv2.1 (vertically). Concentrations used are 100 nM PaurTx3, ProTx-I, ProTx-II, and TsVII, and 1 µM AaHII. The holding voltage was −90 mV, the test pulse duration was 300 ms, and the tail voltage was −50 mV (−80 mV for DII). n = 3–5, and error bars represent SEM. Image published in: Bosmans F et al. (2011) Copyright © 2011 by the Rockefeller University Press. Creative Commons Attribution-NonCommercial-ShareAlike license Larger Image Printer Friendly View |
