XB-IMG-178458
Xenbase Image ID: 178458

|
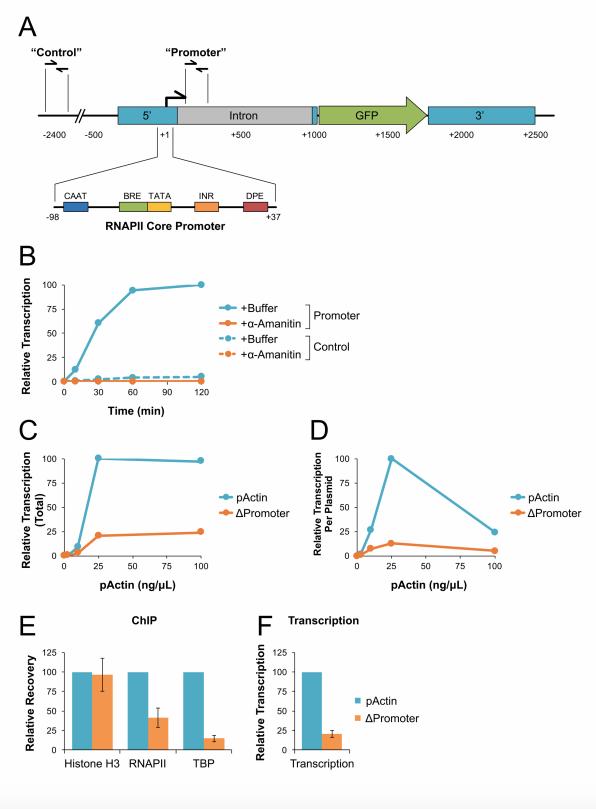
Figure 2. NPE supports regulated and promoter-dependent transcription. (A) pActin schematic. Sequence elements are shown relative to the transcription start site (+1). “Control” and “Promoter” primer pair locations are indicated. (B) pActin was incubated at 10 ng/µL in NPE supplemented with buffer or αamanitin. RNA was isolated at the indicated time points and quantified by RT-qPCR. (C) Different
concentrations of pActin or ΔPromoter plasmid were incubated in NPE for 120 minutes. RNA was isolated and quantified by RT-qPCR using the Promoter primers. (D) Transcription from (C) was normalized based on starting plasmid concentration. (E) pActin or ΔPromoter plasmid were incubated in NPE at 25 ng/µL. At 30 minutes, DNA-bound protein was analyzed by ChIP with the indicated
antibodies. (F) At 120 minutes, RNA was isolated from the reactions in (E) and quantified by RT-qPCR using the Promoter primers. Error bars represent +/- one standard deviation. See Figure S2 for experimental replicates. Image published in: Barrows JK and Long DT (2019) Copyright © 2019. Image reproduced with permission of the Publisher. Larger Image Printer Friendly View |
