XB-IMG-175658
Xenbase Image ID: 175658
|
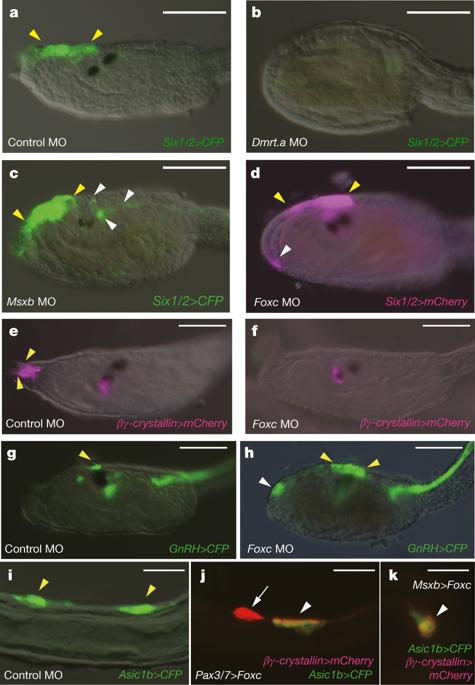
Fig. 2: Functional analysis of the lateral plate ectoderm. a–c, Head regions of larvae that were injected with a Six1/2 > CFP reporter gene. a, Six1/2 expression in the proto-placodal region of control MO injected tadpoles (49 of 49 larvae displayed this expression pattern). The yellow arrowheads identify the normal location of Six1/2 expression. b, Loss of expression in Dmrt.a morphants (49 of 49 larvae). c, Expanded expression of the Six1/2 > CFP reporter gene (white arrowheads) in Msxb morphants (42 of 50 larvae showed this expansion pattern). d, Head regions of a larva that was injected with Foxc MO and Six1/2 > mCherry reporter gene. There is ectopic expression (white arrowhead) in the palp regions of Foxc morphants (35 of 47 larvae showed this phenotype). e, f, Larvae injected with βγ-crystallin > mCherry reporter gene. Yellow arrowheads indicate the βγ-crystallin expressing PSCs in control MO injected larvae (51 of 51 larvae display this expression pattern). f, There is a loss of these cells in Foxc morphants (108 of 108 larvae showed this phenotype). g, h, Larvae injected with a GnRH > CFP reporter gene. Yellow arrowheads identify the GnRH expressing aATENs in a control larva (59 of 59 larvae displayed expression in aATENs). h, There is ectopic expression in the palp regions of Foxc morphants (white arrowheads) (28 of 40 injected larvae showed this phenotype). i–k, Tail regions of larvae injected with Asic1b > CFP (i) and also injected with βγ-crystallin > mCherry reporter gene (j, k). Yellow arrowheads identify the Asic1b expressing BTNs in a control larva (83 of 83 larvae displayed this phenotype). j, Ectopic expression of the βγ-crystallin > mCherry reporter gene in tail regions (white arrowheads) upon misexpression of Foxc by the Pax3/7 enhancer (26 of 55 larvae showed this phenotype). k, Same as j except that Msxb regulatory sequences were used to misexpress Foxc (31 of 57 larvae showed misexpression of βγ-crystallin > mCherry). Anterior to the left; scale bars, 100 μm (a–h), 20 μm (i–k).
Image published in: Horie R et al. (2018) Image downloaded from an Open Access article in PubMed Central. Image reproduced on Xenbase with permission of the publisher and the copyright holder. Larger Image Printer Friendly View |