XB-IMG-120080
Xenbase Image ID: 120080
|
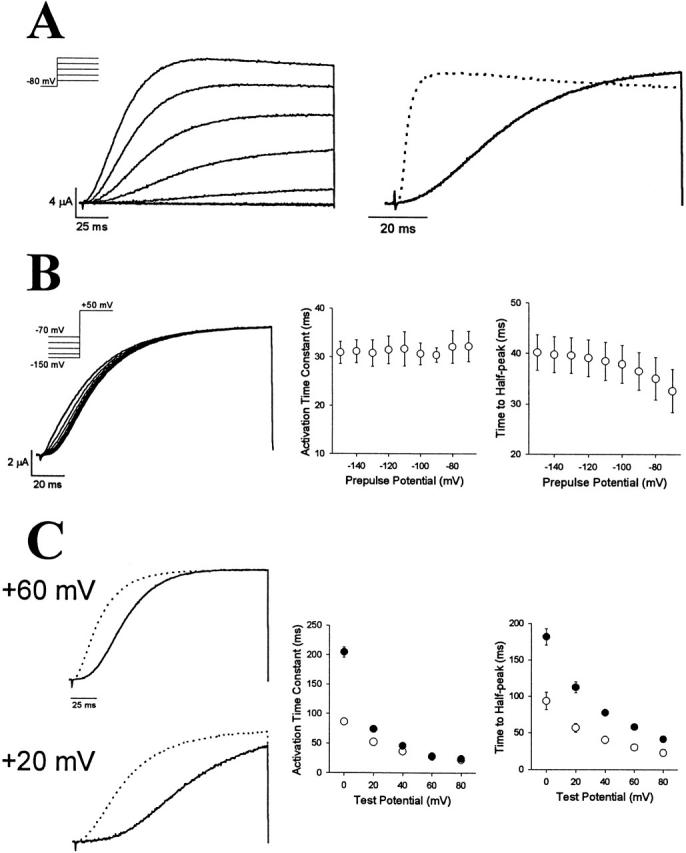
Figure 9. Δ333–337 activation kinetics are sensitive to Mg2+ but unaltered by prepulse hyperpolarization. (A, left) Ionic currents from the Δ333–337 mutant were evoked by pulsing from a holding potential of −80 mV to voltages from −60 to +80 mV in 20-mV increments. Representative traces, 150 ms in length, are shown. (Right) Currents evoked at +60 mV from Δ333–337 (solid trace) and wild-type eag (dashed trace) have been overlaid. (B) Prepulse hyperpolarization increases the delay but does not alter activation kinetics in Δ333–337 channels. (Left) From a holding potential of −80 mV, 150-ms hyperpolarizing prepulses ranging from −150 to −70 mV were applied in 10-mV increments, followed by a 120-ms test pulse to +50 mV. Representative currents evoked by the test pulses are shown. (Middle) Activation time constants at +50 mV, determined by fitting a single exponential function to the late rising phase, have been plotted as a function of prepulse potential. Data are shown as mean ± SEM, n = 6. (Right) To illustrate the effect of hyperpolarizing prepulses on the delay before current activation, the time to half maximal current amplitude at +50 mV has been plotted as a function of prepulse potential. Data are shown as mean ± SEM, n = 6. (C) Comparison of activation kinetics of Δ333–337 channels in the presence and absence of Mg2+. (Left) Representative currents from Δ333–337 channels, evoked by pulses to +60 or +20 mV, as indicated, in the presence (solid traces) or absence (dashed traces) of 2 mM Mg2+, have been overlaid. (Middle) Activation time constants at +50-mV pulse in the presence (•) or absence (○) of 2 mM Mg2+, determined by fitting a single exponential function to the late rising phase, have been plotted as a function of test potential. Data are shown as mean ± SEM, n = 8. (Right) The time to half maximal current amplitude at +50 mV in the presence (•) or absence (○) of 2 mM Mg2+ has been plotted as a function of prepulse potential. Data are shown as mean ± SEM, n = 8. Image published in: Tang CY et al. (2000) © 2000 The Rockefeller University Press. Creative Commons Attribution-NonCommercial-ShareAlike license Larger Image Printer Friendly View |