XB-IMG-128463
Xenbase Image ID: 128463

|
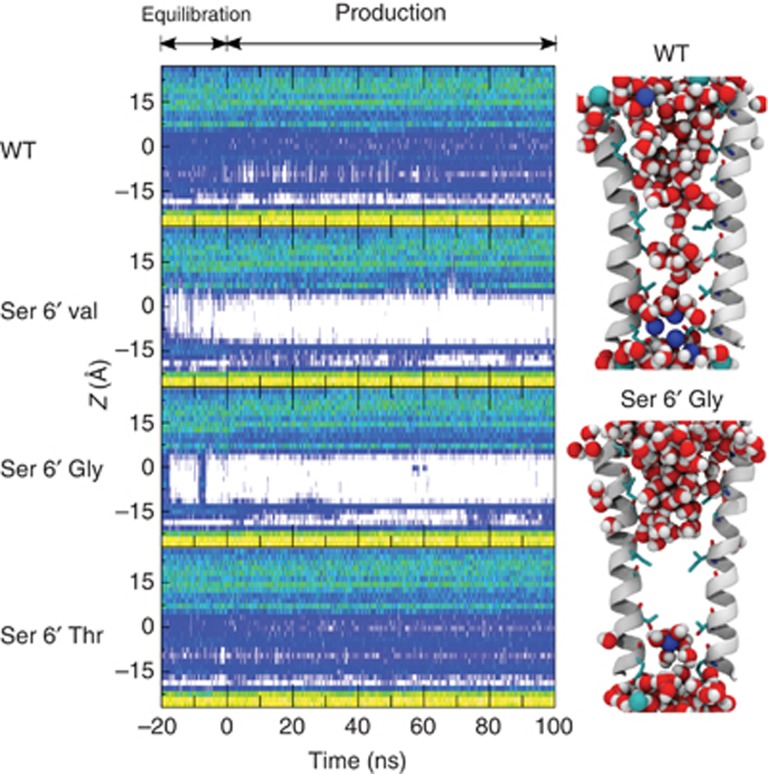
Figure 6. Hydration profiles of GLIC′s pore in WT and Ser6′ mutant simulations. Hydration traces of the pore of GLIC during the 20-ns equilibration (with restraints on the Cα positions) and the following 100 ns production. The origin of the z-axis (0 Å) corresponds to the position of Ile9′. The hydration level is represented using a colour scale from dark blue (low hydration) to cyan, green and yellow (strong hydration). The absence of water is depicted by a white colour. On the right panel, snapshots corresponding to the last frame of the production are shown for the pore of GLIC wt and S6′T mutant. Water molecules are shown as spheres. Image published in: Sauguet L et al. (2013) Copyright © 2013, European Molecular Biology Organization. Creative Commons Attribution-NonCommercial-NoDerivatives license Larger Image Printer Friendly View |
