XB-IMG-119829
Xenbase Image ID: 119829
|
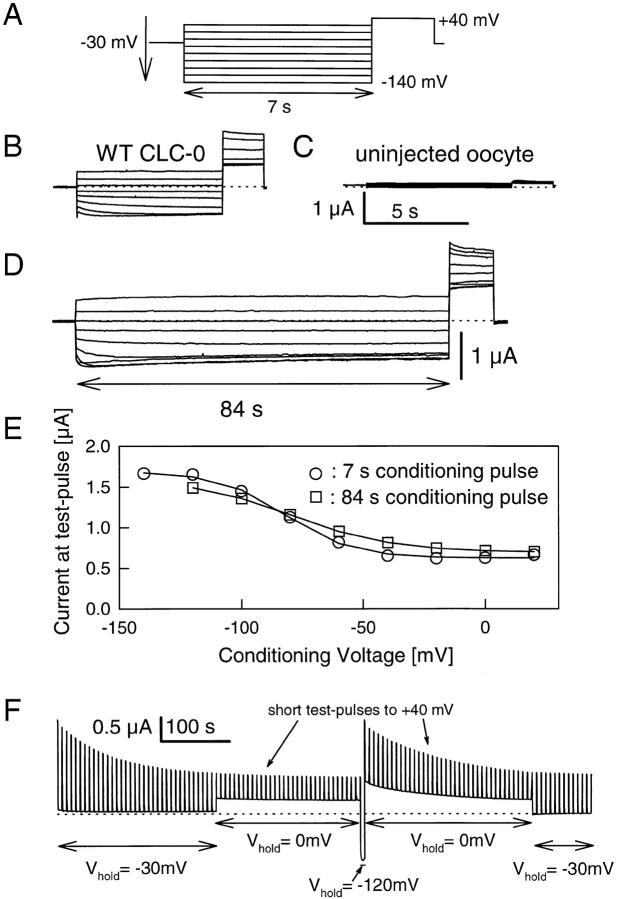
Figure 4. Incomplete deactivation of the slow gate at positive voltages. (A) Usual pulse protocol to measure popenslow (V). The slow gate was progressively opened with 7-s pulses from +20 to −140 mV. The degree of the activation was monitored at the constant “tail” potential of +40 mV. (B) Family of currents obtained by the protocol shown in A from a ClC-0 expressing oocyte. (C) Currents from a noninjected oocyte from the same batch. (D) Currents from the same oocyte as shown in B using a longer prepulse (84 s). (E) I-V relationships obtained from the currents shown in B (circles) and D (squares). Solid lines are Boltzmann fits with V1/2 = −82 mV (circles) and V1/2 = −79 mV (squares). (F) Continuous recording (same oocyte as B and D). Before the start of the recording the voltage had been clamped to −120 mV for several seconds to activate the slow gate. The holding potential was varied as indicated. The small “blips” represent the currents measured during brief steps to +40 mV to monitor the degree of the slow gate activation. Temperature was 28°C for the experiments shown in B, D, E, and F. Image published in: Pusch M et al. (1997) Image reproduced on Xenbase with permission of the publisher and the copyright holder. Creative Commons Attribution-NonCommercial-ShareAlike license Larger Image Printer Friendly View |