XB-IMG-123782
Xenbase Image ID: 123782
|
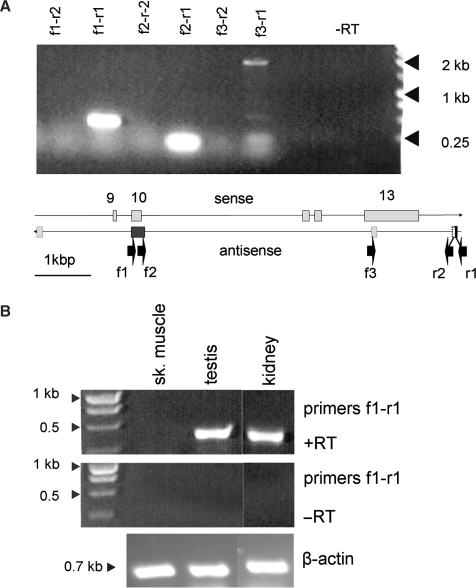
Figure 2. Analysis of the mouse Slc34a1 antisense transcript. (A) Putative splice products were tested by RT–PCR using testis total RNA. Only primers located within sense exon 10 and at the profilin 5′end (f1-r1; f2-r1) gave detectable amplicons. The 2 kb band (f3-r1) derived from genomic DNA. If genomic DNA was used instead of cDNA long range PCR yielded the expected fragments of 2 kb (f3-r2) and about 6.5 kb (f1-r2 and f2-r2, data not shown). (B) Tissue distribution of the antisense transcript in mouse testis, kidney and skeletal muscle. The lower panels represent the negative control minus reverse transcriptase and β-actin, respectively. The locations of the primers are indicated on the scheme in (A). Image published in: Carlile M et al. (2009) © 2009 The Author(s). Creative Commons Attribution-NonCommercial license Larger Image Printer Friendly View |