XB-IMG-86668
Xenbase Image ID: 86668
|
|
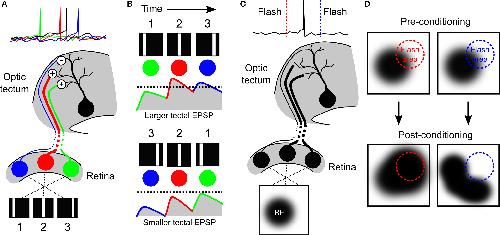
Figure 3. Development of direction selectivity and RF structure via STDP in the optic tectum. (A) The principle of how STDP can induce direction selectivity in the optic tectum was demonstrated by Mu and Poo (2006) , by mimicking movement across the retina with flashes of a white bar at three different locations in visual space. If the tectal cell (black) was forced to spike soon after the second flash, the RF of the cell was altered by STDP in an asymmetric manner that potentiated responses to the first and second bars (green and red cells), but depressed responses to the third bar (blue cell). (B) Asymmetric changes in a RF can produce direction selectivity due to the differences in temporal summation for one direction versus the other. If the strengthened inputs are activated first, they can summate with subsequent inputs to produce a high level of depolarization in postsynaptic tectal cells producing suprathreshold activity (top, dashed line indicates hypothetical spike threshold). In contrast, if the weaker inputs are stimulated first, they will have decayed by the time subsequent inputs arrive and so less temporal summation occurs and inputs remain subthreshold (bottom). (C) The strength of the connections onto a tectal neuron determines its RF profile, as illustrated here for a hypothetical cell. (D) Vislay-Meltzer et al. (2006) demonstrated that this RF profile could be altered by STDP to either move towards or away from a given region of space. If a flash occurred prior to a tectal cell�s spikes (red line), the RF tended to shift toward that area. In contrast, if a flash occurred after a tectal cell�s spikes (blue line) the RF tended to shift away from the area of the flash. Interestingly, they also observed that the RFs potentiated in areas outside of the area of the flash, as shown. - See more at: http://journal.frontiersin.org/Journal/10.3389/fnsyn.2010.00007/full#sthash.iocnGBhs.dpuf Image published in: Richards BA et al. (2010) Image downloaded from an Open Access article in PubMed Central. Copyright © 2010 Richards, Aizenman and Akerman. Larger Image Printer Friendly View |