XB-IMG-118902
Xenbase Image ID: 118902
|
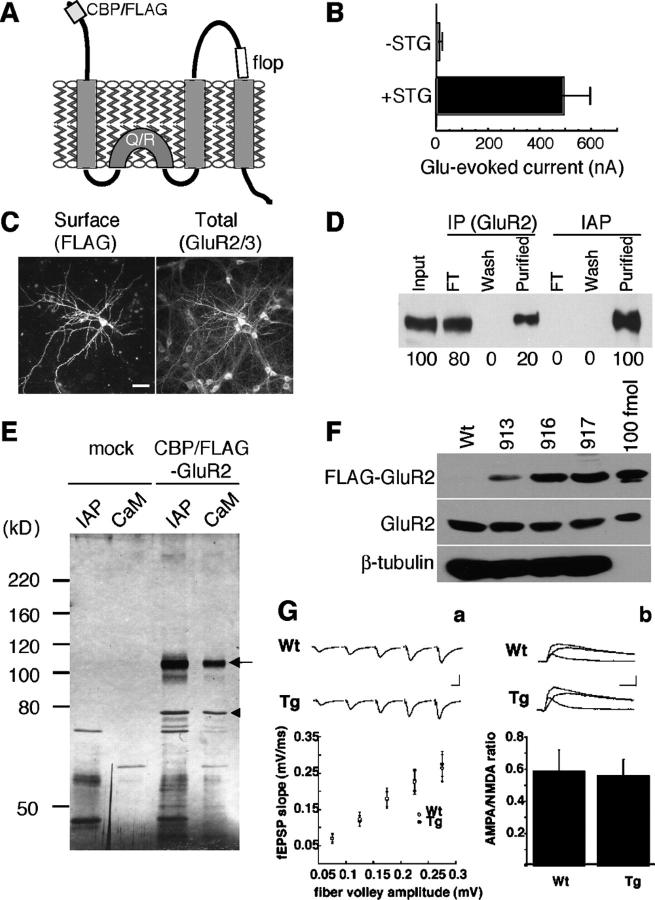
Figure 2. Functional expression of CBP/FLAG-GluR2 in heterologous cells and in transgenic mouse brain. (A) Schematic presentation of CBP/FLAG-GluR2. Calmodulin-binding peptide (CBP) and FLAG peptide sequences were inserted after the signal sequence of mouse GluR2 (flop form edited at position 586 (Q/R)). (B) In X. laevis oocytes expressing CBP/FLAG-GluR2, glutamate-evoked currents were vastly increased by coexpression of stargazin cRNA. (C) Surface receptors expressed in hippocampal neurons were live labeled with anti-FLAG M2 and total GluR2 was stained with anti-GluR2/3. Bar, 20 μm. (D) More efficient isolation of CBP/FLAG-GluR2 by immunoaffinity purification (IAP; anti-FLAG M2 agarose) than by conventional immunoprecipitation (anti-GluR2 antibody). Almost 100% of solubilized CBP/FLAG-GluR2 was isolated by IAP. FT, flow-through. (E) Two-step purification of CBP/FLAG-GluR2. The extracts of HEK cells transfected with mock vector or CBP/FLAG-GluR2 were subjected to sequential affinity chromatography: IAP and calmodulin-affinity chromatography (CaM). The arrow indicates the 110-kD protein (CBP/FLAG-GluR2). The arrowhead indicates the copurified 78-kD protein (identified as BiP/Grp78 by mass spectrometry). (F) Whole brain extracts (50 μg) from the indicated transgenic mouse lines and 100 fmol of CBP/FLAG-GluR2 purified from HEK cells were probed with the indicated antibodies. CBP/FLAG-GluR2 represents ∼50% of the endogenous protein in line 917. (G) Basal synaptic transmission is normal in transgenic GluR2 mice. (a) Input–output curve for basal synaptic transmission in hippocampal slices from wild type (Wt; n = 16) and transgenic (Tg; n = 18) mice. Each point represents the mean ± SEM for each bin. Sample fEPSPs at different stimulus intensities are shown on top. Bars: (y-axis) 0.5 mV; (x-axis) 20 ms. (b) AMPA/NMDA ratios were calculated by evoking dual-component EPSCs (Wt, n = 5; and Tg, n = 9). Histogram represents the AMPA/NMDA ratio mean ± SEM. Sample traces of the mixed and isolated AMPA- and NMDA-mediated EPSCs from wild-type and transgenic mice are shown on top. Bars: (y-axis) 100 pA; (x-axis) 20 ms. Image published in: Fukata Y et al. (2005) Copyright © 2005, The Rockefeller University Press. Creative Commons Attribution-NonCommercial-ShareAlike license Larger Image Printer Friendly View |