XB-IMG-121243
Xenbase Image ID: 121243
|
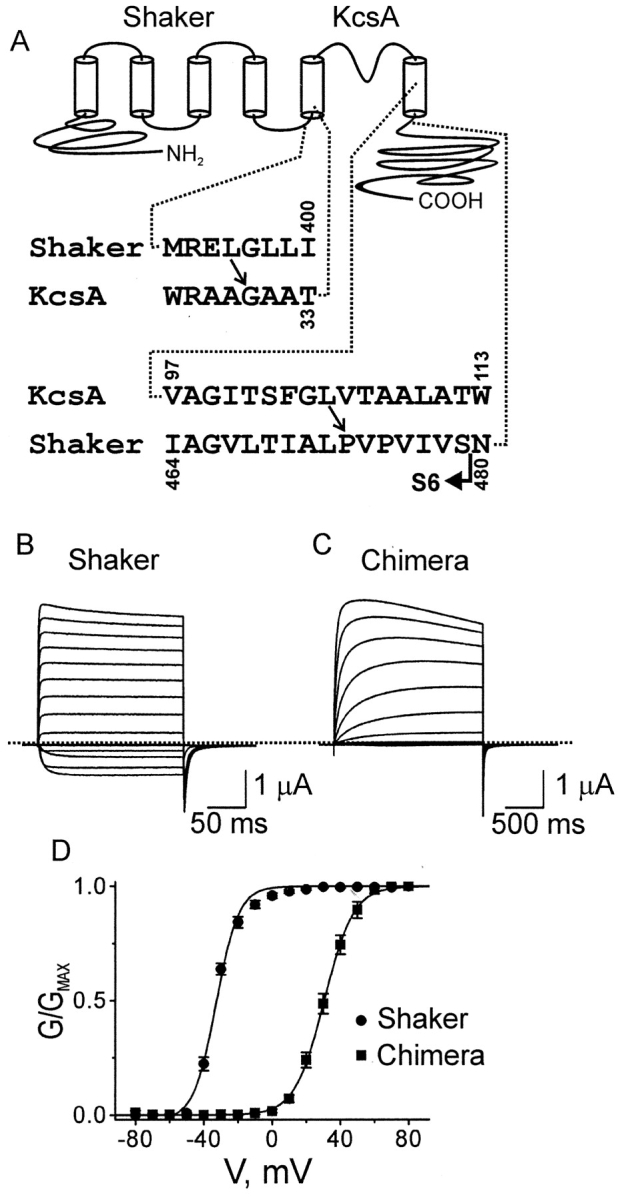
Figure 2. . Comparison between Shaker and a Shaker-KcsA chimera. (A) Schema of the polypeptide chain topology of a Shaker-KcsA chimeric channel subunit and partial sequences of the parent channels around the splicing sites. (B–D) Currents of Shaker (B) and the chimera (C), and the corresponding G-V curves (D) where the data points represent mean currents (± SEM; n = 9 and 15). The fitted curves superimposed on the data correspond to the Boltzmann function, yielding V1/2 = −32.8 ± 0.3 mV and valence (Z) = 3.9 ± 0.3 for Shaker, and V1/2 = 30.5 ± 0.3 mV and Z = 3.0 ± 0.1 for the chimera. Image published in: Lu Z et al. (2002) Copyright © 2002, The Rockefeller University Press. Creative Commons Attribution-NonCommercial-ShareAlike license Larger Image Printer Friendly View |