XB-IMG-124357
Xenbase Image ID: 124357
|
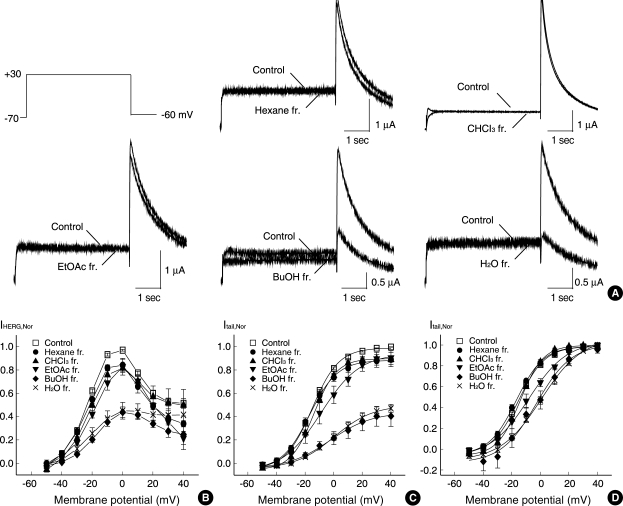
Fig. 3. Effect of different solvent fractions of L. erythrocarpa on the HERG current by comparing the changes of IHERG and tail currents with each solvent fraction: the hexane fraction, CHCl3 fraction, EtOAc fraction, BuOH fraction, and H2O fraction at the same concentrations (100 µg/mL). (A) Superimposed current traces from a cell depolarized to +30 mV before and after exposure to the hexane fraction, CHCl3 fraction, EtOAc fraction, BuOH fraction, and H2O fraction of L. erythrocarpa, respectively. (B) Plot of the HERG current (IHERG) measured at the end of depolarizing pulses against the pulse potential in different solvent fractions of L. erythrocarpa (obtained from A). (C) Plot of the normalized tail current measured at its peak just after repolarization. The amplitude of the tail current in the absence of L. erythrocarpa was taken as one. Control data were fitted to the Boltzmann equation, y=1/{1+exp[(-V+V1/2)/dx]}, with V1/2 of -15.3 mV. (D) Activation curves with values normalized to the respective maximum value for each fraction of L. erythrocarpa. Symbols with error bars represent means±SEM (n=8-22). Image published in: Hong HK et al. (2009) Copyright © 2009 The Korean Academy of Medical Sciences. Creative Commons Attribution-NonCommercial license Larger Image Printer Friendly View |