XB-IMG-127703
Xenbase Image ID: 127703
|
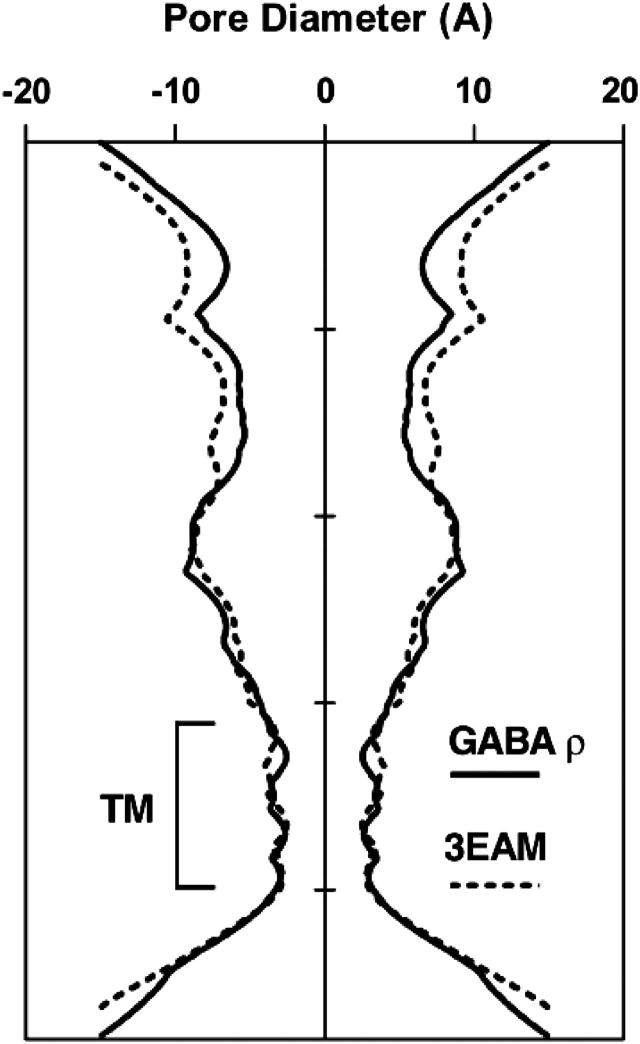
Fig. 10. A comparison of the channel from 3EAM and the ρ1 GABAC receptor homology model used in this study. The profile is plotted as the average pore diameter for the whole pentamer (solid line, ρ1 GABAC receptor homology model; dotted line, 3EAM). Image published in: Huang SH et al. (2012) © 2012 Elsevier Ltd. Creative Commons Attribution license Larger Image Printer Friendly View |