XB-IMG-127348
Xenbase Image ID: 127348
|
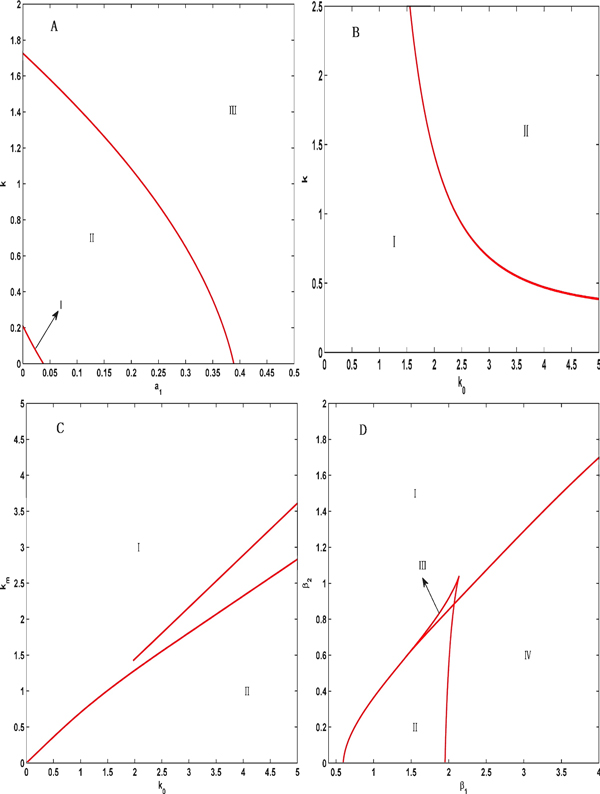
Figure 1. Two-parameter bifurcation diagrams for four groups of parameters. (A) The bifurcation diagram for the coupling strength k and the synthetic rate α1. The whole region is divided into three regions I, II and III. I and III: stable regions. II: oscillation region. (B) The bifurcation diagram for the coupling strength k and the coefficient k0. I: oscillation region. II: stable region. (C) The bifurcation diagram for the degradation rate km and the coefficient k0. I: oscillation region. II: stable region. The behavior of the system in the region between two lines is unclear. (D) The bifurcation diagrams for the degradation rates β1 and β2. I, II and III: stable regions. Region IV: oscillation region. Image published in: Zhang W and Zou X (2012) Copyright ©2012 Zhang and Zou; licensee BioMed Central Ltd. Creative Commons Attribution license Larger Image Printer Friendly View |