XB-IMG-127817
Xenbase Image ID: 127817
|
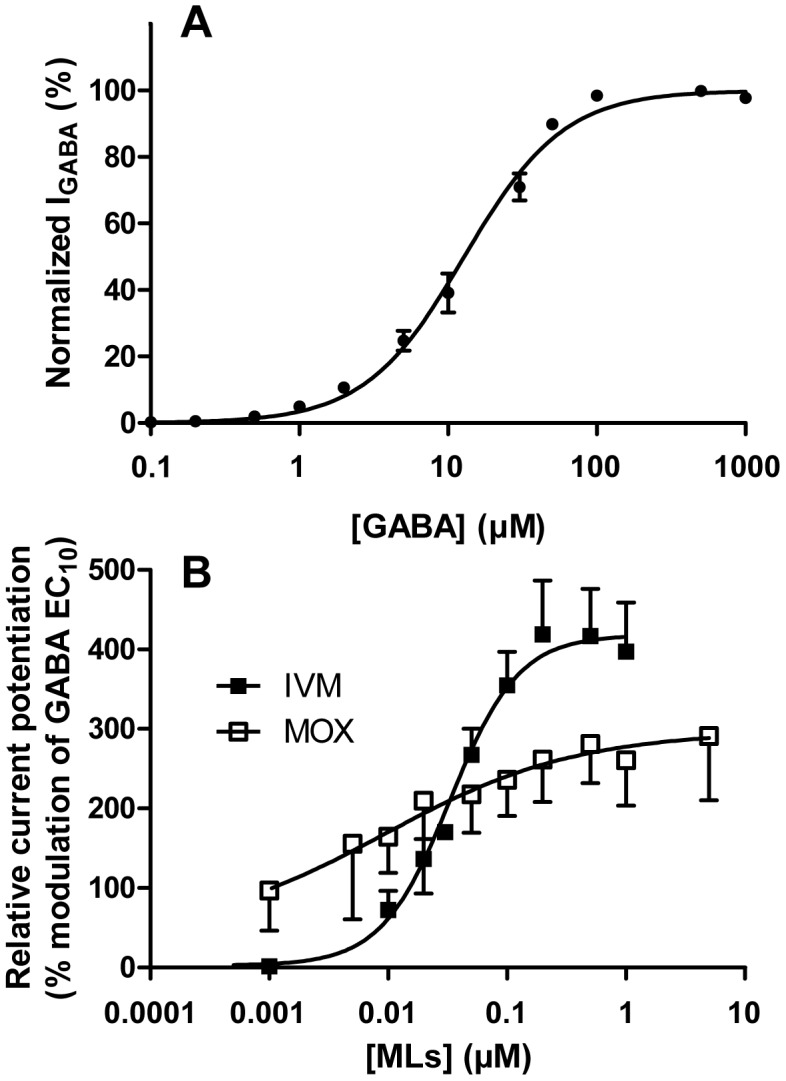
Figure 4. Concentration-response curves of rat GABA(A) receptor expressed in Xenopus oocytes.(A) Average concentration-response curve for the reference agonist GABA alone. Data were normalized to the maximum GABA-evoked response and fitted to the Hill equation (EC50 = 12.8±0.3 µM, Hill slope = 1.30±0.02. Data are given as mean ± S.E.M. from 3 independent oocytes batches (n = 4 oocytes for each batch). (B) Concentration-dependent potentiation of the GABA receptor, presented as the percentage of the GABA-evoked response at EC10 (2 µM). To analyse the potentiation of the GABA-evoked current induced by IVM or MOX, GABA-responsive oocytes were exposed to 2 µM GABA, followed by washing and then 2 µM GABA in association with increasing concentrations of IVM (n = 8) or MOX (n = 5). Data were fitted to the Hill equation and are given as mean ± S.E.M. Image published in: Ménez C et al. (2012) Image reproduced on Xenbase with permission of the publisher and the copyright holder. Creative Commons Attribution license Larger Image Printer Friendly View |