XB-IMG-197113
Xenbase Image ID: 197113
|
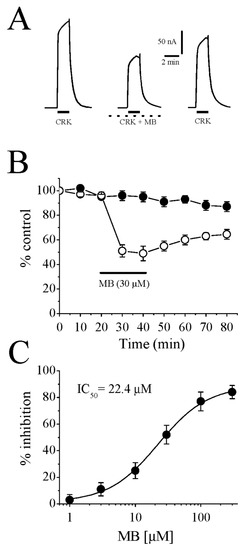
Figure 1. Cromakalim-induced outward currents are inhibited by MB in follicular cells of Xenopus oocytes. (A) Currents activated by 100 μM cromakalim (left), during co-administration of cromakalim and 30 μM MB following 20 min MB preincubation (middle), 20 min recovery (right). Administration times for cromakalim are shown with solid horizontal bars. Dotted lines represent continuous MB application during recordings. (B) Time course of the peak cromakalim-activated currents are shown in the absence (filled circles) and the presence of 30 µM MB (open circles). Each data point indicates the normalized means and S.E.M. of five to six experiments. The horizontal bar represents the duration of MB administration. (C) Concentration-response curve for the inhibitory effect of MB on cromakalim (100 μM)-activated currents. Data points are shown as means ± S.E.M. (n = 4–5). The curve is the best fit of the data to the logistic equation presented in the methods section. CKL: cromakalim; MB: methylene blue. Image published in: Isaev D et al. (2023) © 2023 by the authors. Creative Commons Attribution license Larger Image Printer Friendly View |