XB-IMG-125921
Xenbase Image ID: 125921
|
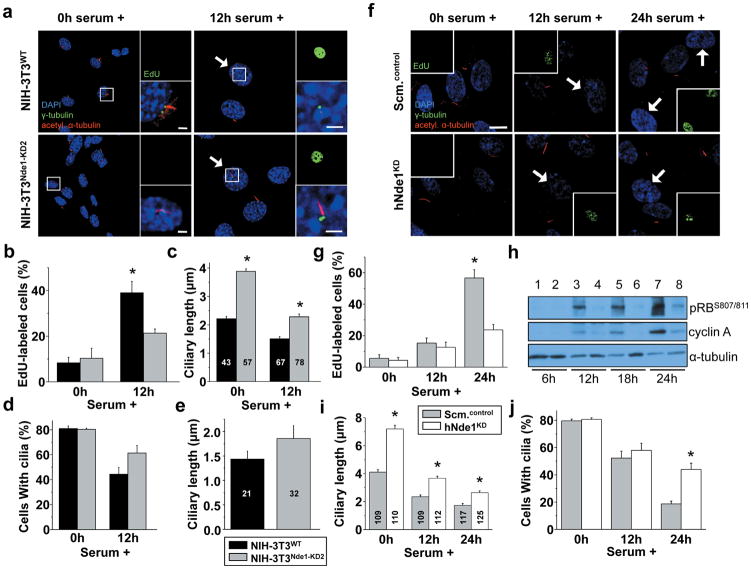
Figure 5. Nde1 depletion causes a delay in cell cycle re-entry. (a) NIH-3T3WT and NIH-3T3Nde1-KD2 cells were arrested in G0 by 24h serum starvation (0h serum +) and induced to re-enter the cell cycle by serum re-stimulation for 12h (12h serum +). Cells were pulse-labeled with EdU and immunostained with antibodies against γ-tubulin (green), acetylated α-tubulin (red), and EdU (green, inset). For illustration purposes, EdU labeling is shown as a 25% reduction of the projected image. Arrows indicate EdU-labeled cells. Scale bar, 2.5 μm. (b) Percentage of EdU-positive NIH-3T3WT (black) or NIH-3T3Nde1-KD2 (gray) cells following serum re-stimulation (n=3 independent experiments). “*”, P <0.05. Student’s t test. (c) Ciliary length of NIH-3T3WT (black) at 0 (n=43) or 12h (n=67) of serum re-stimulation and NIH-3T3Nde1-KD2 (gray) at 0 (n=57) or 12 h (n=78) of serum re-stimulation. “*”, P <0.05. Student’s t test. (d) Percentage of ciliated NIH-3T3WT (black bar) or NIH-3T3Nde1-KD2 (gray bar) cells following serum re-stimulation (n=3 independent experiments). “*”, P <0.05. Student’s t test. (e) Ciliary length of EdU-positive NIH-3T3WT (black, n=21) or NIH-3T3Nde1-KD2 (gray, n=32) cells following serum re-stimulation. “*”, P <0.05. Student’s t test. (f) Scm.control or hNde1KD RPE1-hTERT cells were immunostained with antibodies against γ-tubulin (green), acetylated α-tubulin (red), and EdU (green, inset). Arrows indicate EdU-labeled cells. Scale bar, 10 μm. (g) Percentage of Scm.control (gray) or hNde1KD (white) RPE1-hTERT cells labeled with EdU at 24h following serum starvation (0h serum +), 12h (12h serum +), and 24h following serum re-stimulation (24h serum +) (n=3 independent experiments). “*”, P <0.05. Student’s t test. (h) Phospho-RB (pRBS807/811) and cyclin A levels in Scm.control (lanes 1, 3, 5, and 7) and hNde1KD RPE1-hTERT cells (lanes, 2, 4, 6, and 8) at 6h, 12h, 18h, and 24h following serum re-stimulation (serum +). α-tubulin was used as loading control. (i) Ciliary length of RPE1-hTERT Scm.control (gray) at 0 (n=109), 12 (n=109), or 24h (n=117) of serum re-stimulation and hNde1KD (white) at 0 (n=110), 12 (112), or 24h (n=125) of serum re-stimulation. “*”, P <0.05. Student’s t test. (j) Percentage of ciliated Scm.control or hNde1KD RPE1-hTERT cells following serum re-stimulation (n=3 independent experiments). “*”, P<0.05. Student’s t test. Image published in: Kim S et al. (2011) Image downloaded from an Open Access article in PubMed Central. Image reproduced on Xenbase with permission of the publisher and the copyright holder. Larger Image Printer Friendly View |