XB-IMG-124503
Xenbase Image ID: 124503
|
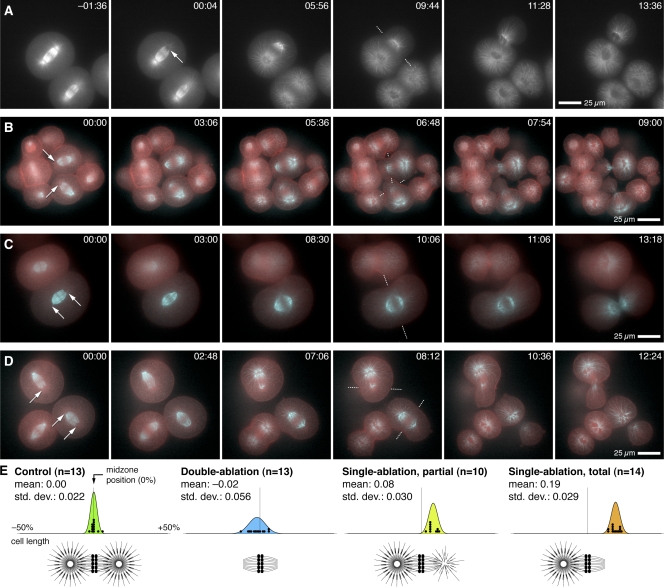
Figure 8. Centrosome ablation displaces furrows. (A–D) Single-plane recordings of sand dollar embryos expressing EMTB-3G alone (A) or GFP-rGBD (red) and 3C-EMTB (cyan; B–D); time is shown in minutes:seconds after last irradiation. Arrows, ablation sites; dotted lines, furrow plane. (A) Single-pole ablation in a moderately large cell. Few astral microtubules remain; furrowing occurs over the spindle end rather than the midzone (see Video 7). (B) Two single-pole ablations. Furrows form over and close upon the ablated end. In the top cell, chromosomes are partitioned by the furrow; in the bottom cell, they are not. Rho activity zones in ablated cells are similar to normal cells but shifted. (C) Double-pole ablation in a large cell. A broad furrow with barely detectable Rho activity forms above the spindle midplane and closes between spindle halves. (D) A normal cell (left), singly ablated cell (top), and doubly ablated cell (right). The furrow in the doubly ablated cell is broad, with dilute Rho activity, but closes accurately. The furrow in the singly ablated cell is shifted away from the midplane. (E) Distances (percentage of cell length) between spindle midplane and furrow plane in control, double-, and single-ablated cells (dots) superimposed upon normal curves computed from mean and standard deviation. Video 9 corresponds to B–D. Image published in: von Dassow G et al. (2009) © 2009 von Dassow et al. Creative Commons Attribution-NonCommercial-ShareAlike license Larger Image Printer Friendly View |