XB-IMG-128737
Xenbase Image ID: 128737

|
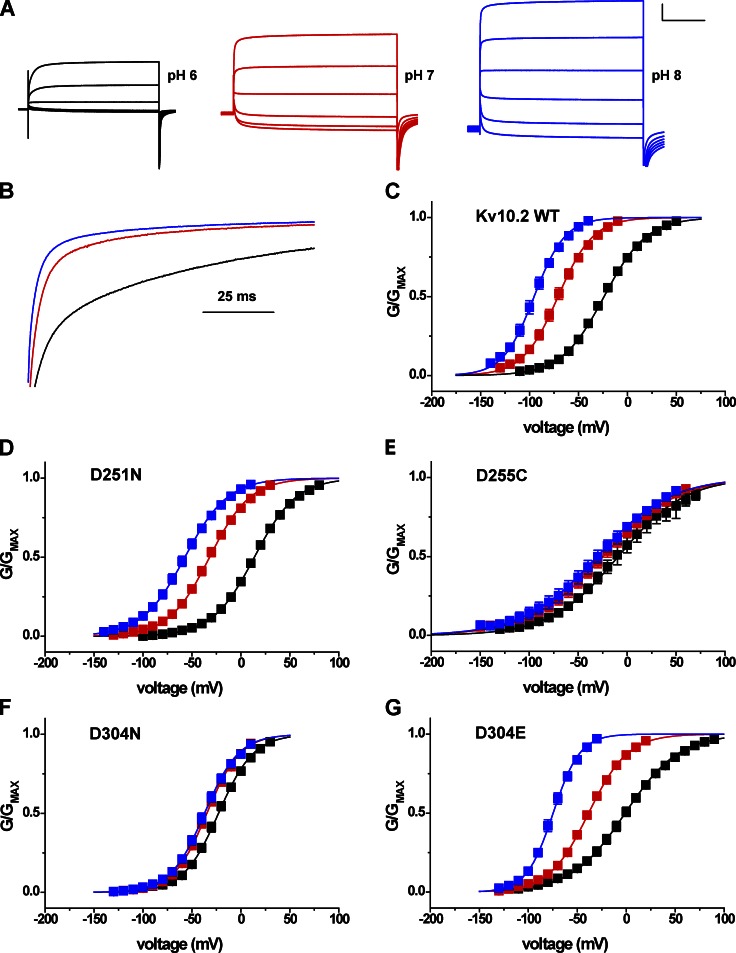
Figure 9. High sensitivity to extracellular pH in Kv10.2 is conferred by EAG-specific acidic residues in the voltage sensor. (A) Kv10.2 current traces elicited by 2-s depolarization steps from −80 to 20 mV in 20-mV increments in bath pH 6, 7, and 8. 50 mM bath K+ was used to accentuate inward tail currents at the −100-mV holding potential. Scale bar: 1 µA, 500 ms. (B) Current traces recorded at 20 mV were normalized and superimposed to illustrate the effect of bath pH on activation time course. pH is encoded by color as in A. (C) Normalized GV relations for Kv10.2 obtained from isochronal tail current measurements at −100 mV in 50 mM K+ after 2-s steps to the indicated voltages in pH 6 (black), 7 (red), and 8 (blue). (D–G) Similar GV curves obtained for Kv10.2 voltage sensor acidic residue mutants D251N (D1N), D255C (D5C) D304N (D6N), and D304E (D6E). Data points in C–G show mean ± SEM (n = 4–10), and curves show single Boltzmann distribution fits; V50, slope factors, and ΔV50 (pH 8 to 6) are reported in Table 1 and Fig. 10. Image published in: Kazmierczak M et al. (2013) © 2013 Kazmierczak et al. Creative Commons Attribution-NonCommercial-ShareAlike license Larger Image Printer Friendly View |
