XB-IMG-124172
Xenbase Image ID: 124172
|
|
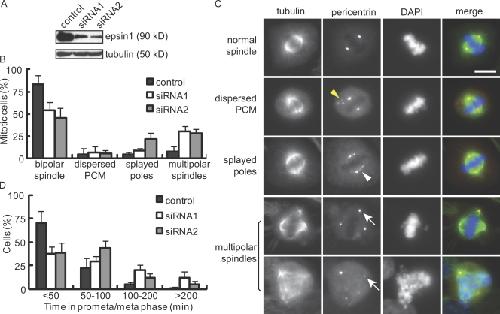
Figure 1. Effects of epsin1 reduction on mitosis in HeLa cells. (A) Western blotting of epsin1 48 h after siRNA transfection. Each oligonucleotide targeting different regions of human epsin1 caused an ∼80% reduction of epsin1 at 48 h. α-Tubulin was used as a loading control. (B) Quantification of spindle defects in HeLa cells treated with control or epsin1 siRNA oligonucleotides. Results from five independent experiments were averaged. Spindles were analyzed based on α-tubulin and pericentrin staining, with >100 prometaphase and metaphase cells counted in each condition per experiment. (C) Examples of normal and abnormal spindles visualized by α-tubulin (green), pericentrin (red), and DAPI (blue) staining. Yellow and white arrowheads indicate cytoplasmic pericentrin staining and stretched pericentrin staining along the unfocused spindle poles, respectively. White arrows point to multiple spindle poles. (D) Reduction of epsin1 affects mitotic progression. HeLa cells stably expressing histone H2B–GFP were treated with control or epsin1 siRNA. Live imaging was acquired at 3-min intervals during 32–48 h after transfection (Fig. S1 C). Quantification of the time between nuclear envelope breakdown and chromosome segregation is shown. Results from three independent experiments were averaged, with >100 mitotic cells analyzed in each condition. (B and D) Error bars show standard deviation. PCM, pericentriolar material. Bar, 10 μm. Image published in: Liu Z and Zheng Y (2009) © 2009 Liu and Zheng. Creative Commons Attribution-NonCommercial-ShareAlike license Larger Image Printer Friendly View |